 FastToChart
Convert Waterfall and Financial Bridge Charts from Images
Financial waterfall charts and variance bridges illustrate how starting metrics (such as revenue or gross profit) transition to ending results (such as EBITDA or net income) through positive and negative increments. FastToChart converts static waterfall screenshots into live PowerPoint bridge charts and structured Excel calculation models.
Upload chartHow it works
- 1Upload your financial waterfall screenshot, earnings release image, or deck slide.
- 2The engine classifies baseline pillars, floating positive/negative deltas, and connector lines.
- 3Export to an editable PowerPoint chart or structured Excel spreadsheet.
A chart you can work with
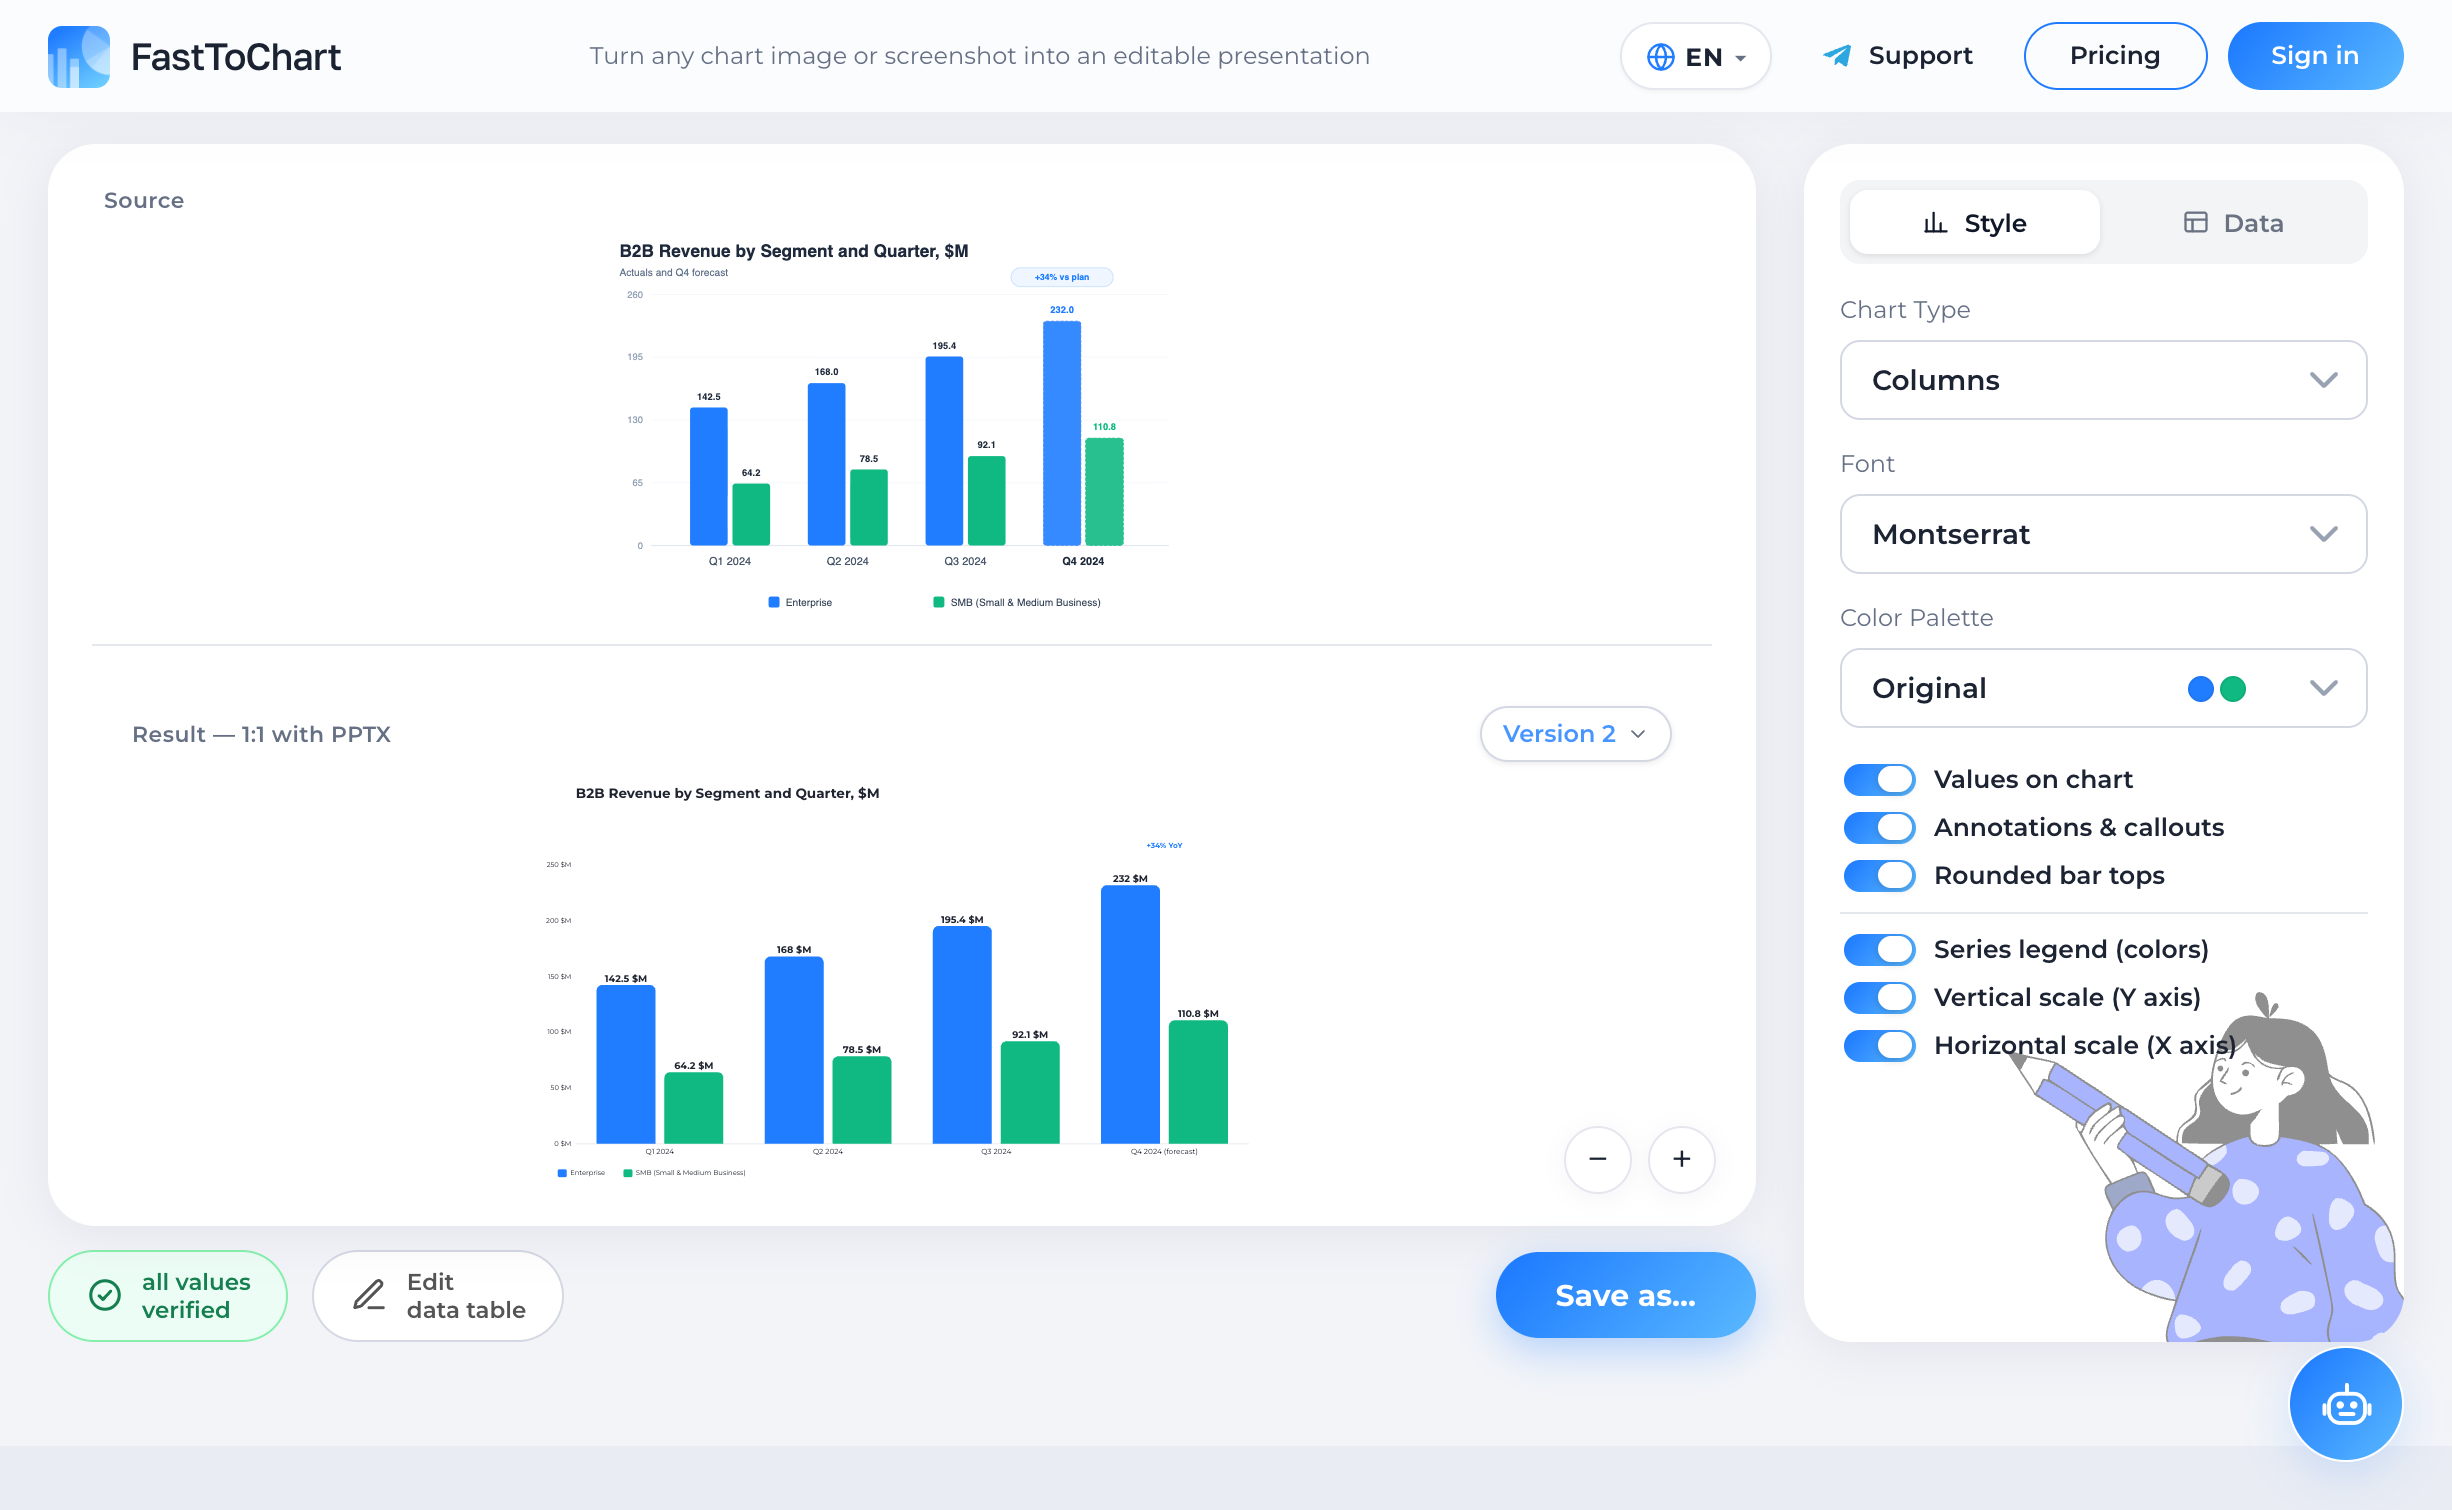
Verify extracted values, update numbers, and customize styling in a unified editor.
- Data table alongside your chart
- Colors and labels under your control
- Editable presentation-ready files
Understanding the Chart and Structure
A waterfall chart (also known as a bridge chart or cascade graph) is an essential visualization in corporate finance, management consulting, and strategic planning. It breaks down the cumulative impact of sequential positive revenue drivers and negative cost deductions on an overarching financial metric.
Common applications include quarterly EBITDA variance bridges, budget vs. actual variance decomposition, pricing vs. volume effect analysis, and cash flow reconciliations.
Anatomy and Key Components
Waterfall visualizations follow strict structural conventions that require careful parsing during automated extraction:
Why Manual Extraction Fails
In PowerPoint and Excel, standard native chart tools often struggle with waterfall bridges, leading analysts to build them by pasting floating rectangle shapes and manually connecting dashed lines. When executive numbers change before a board presentation, modifying every floating bar position and connector by hand is stressful and error-prone.
Even worse, manual extraction of financial reports risks transcribing inverted signs (+/-) or misinterpreting whether a bar is a standalone total or a floating incremental delta. FastToChart preserves exact accounting signs, verifies that running increments reconcile mathematically with final totals, and generates true native Office bridge objects.
Data Verification Best Practices
Frequently Asked Questions
The engine checks whether the column rests on the zero baseline and inspects categorical keywords such as 'Total', 'Baseline', 'Net', or 'EBITDA'.
Try it on your chart
Upload an image, presentation, or PDF — the first three recognitions are free, and editing data or exporting files is never metered.
Open tool