 FastToChart
PlotDigitizer Alternative: Faster AI Data Extraction
Still calibrating axes and clicking points manually in PlotDigitizer? FastToChart uses computer vision to automatically extract numbers, labels, colors, and styles from any chart image in seconds.
Upload chartChart Image
Sales TrendEditable
Data24353050
PowerPoint · Excel · CSV · PNG
Any sourceImage, PDF, or presentation
Your data & styleCustomize numbers, labels, and colors
Ready to workExport to PowerPoint, Excel, CSV, and PNG
How it works
- 1Upload your graph screenshot or data image.
- 2The vision model reads axis coordinates, series points, and legend keys automatically.
- 3Download an organized Excel table (.xlsx) or an editable PowerPoint (.pptx) deck.
From image to data
A chart you can work with
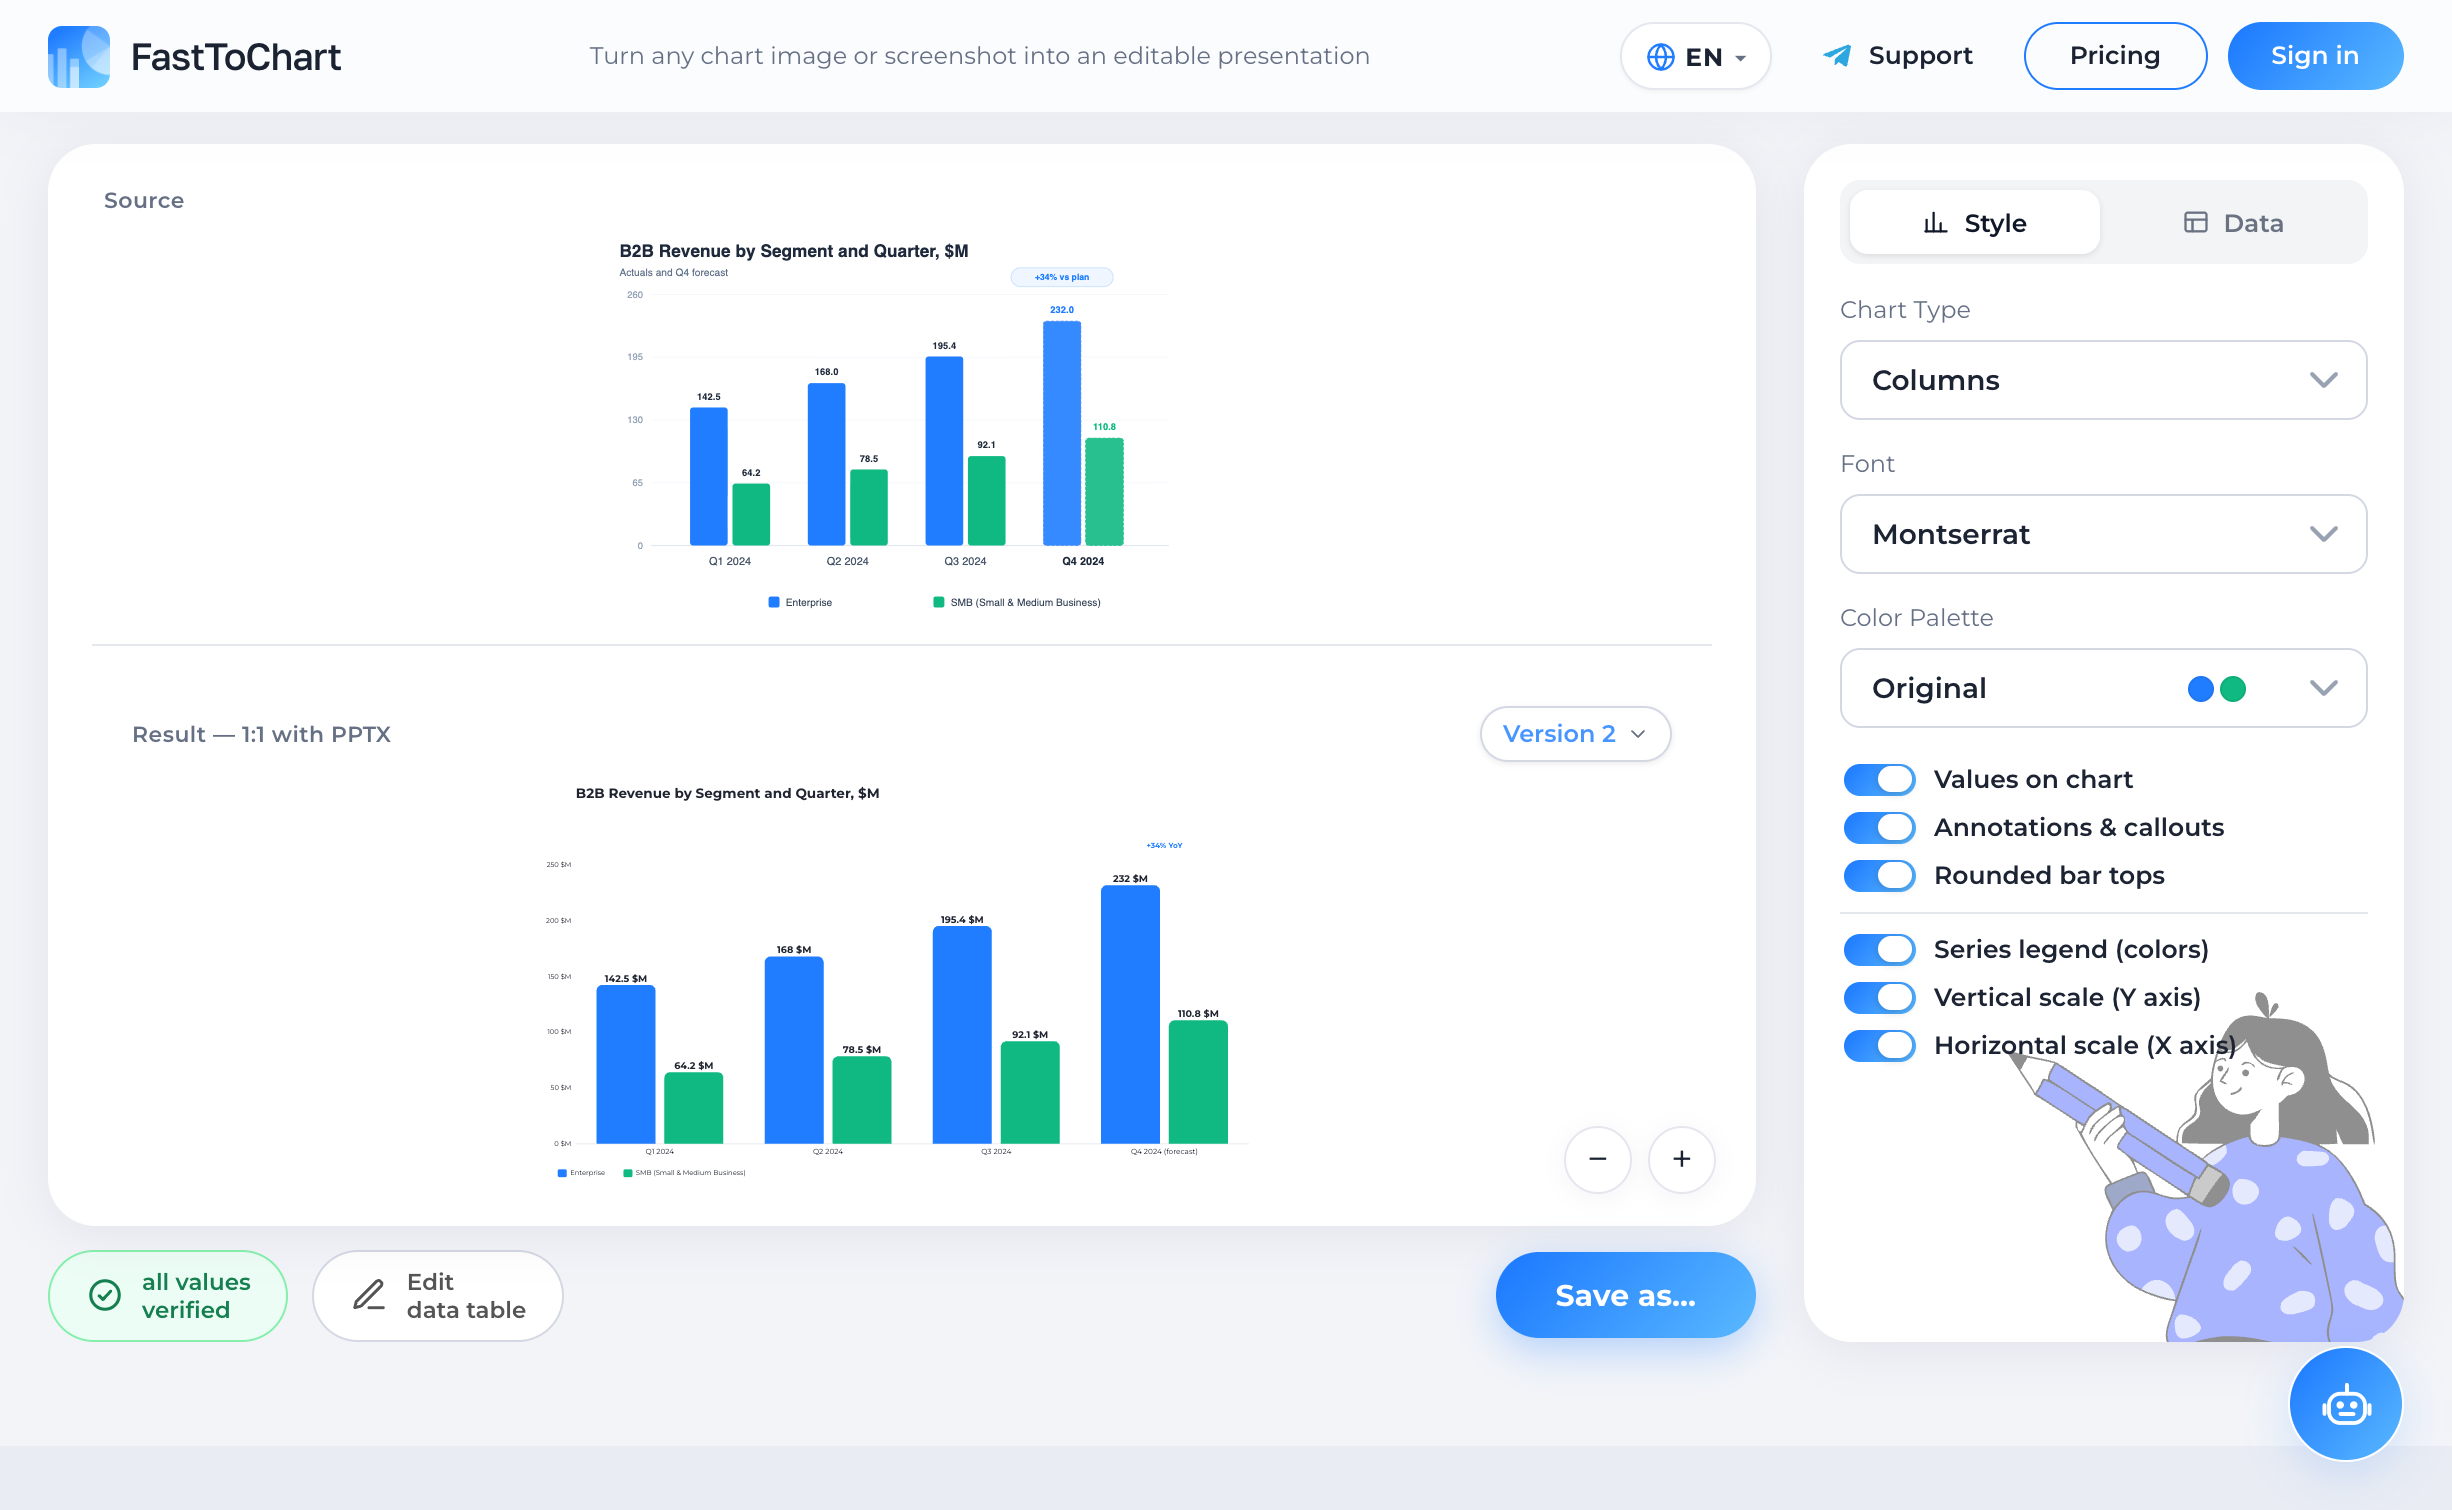
Verify extracted values, update numbers, and customize styling in a unified editor.
- Data table alongside your chart
- Colors and labels under your control
- Editable presentation-ready files
FastToChart vs. PlotDigitizer Comparison
PlotDigitizer relies on classical coordinate math that demands user interaction for every single axis and dataset. FastToChart leverages multimodal AI to comprehend charts holistically.
| Feature | PlotDigitizer | FastToChart |
|---|---|---|
| Axis Setup | Manual point alignment | Automatic AI detection |
| Processing Speed | 2–5 minutes per chart | Under 5 seconds |
| Presentation Export | Raw data / image only | Native PowerPoint (.pptx) with live charts |
| Excel Export | Basic CSV | Formatted .xlsx with data confidence sheet |
| Browser Extension | None | Full Chrome MV3 side panel extension |
Zero-Click Automation
Built for Business & Financial Decks
Frequently Asked Questions
FastToChart typically completes a full extraction in 3–5 seconds, compared to 3–7 minutes of manual calibration in PlotDigitizer.
Try it on your chart
Upload an image, presentation, or PDF — the first three recognitions are free, and editing data or exporting files is never metered.
Open tool