 FastToChart
Convert Chart Screenshots into Editable Charts Online
Received a chart as a static picture, but need to update numbers, change colors, or edit the presentation? FastToChart scans your chart image and reconstructs it into an editable, native chart with exact values and formatting intact.
Upload chartHow it works
- 1Upload your chart screenshot, photo, or sketch — drag & drop or paste from clipboard.
- 2AI automatically detects the chart type, extracts values, series names, colors, and axes.
- 3Verify extracted numbers in the interactive data table and export directly to PowerPoint, Excel, CSV, or PNG.
A chart you can work with
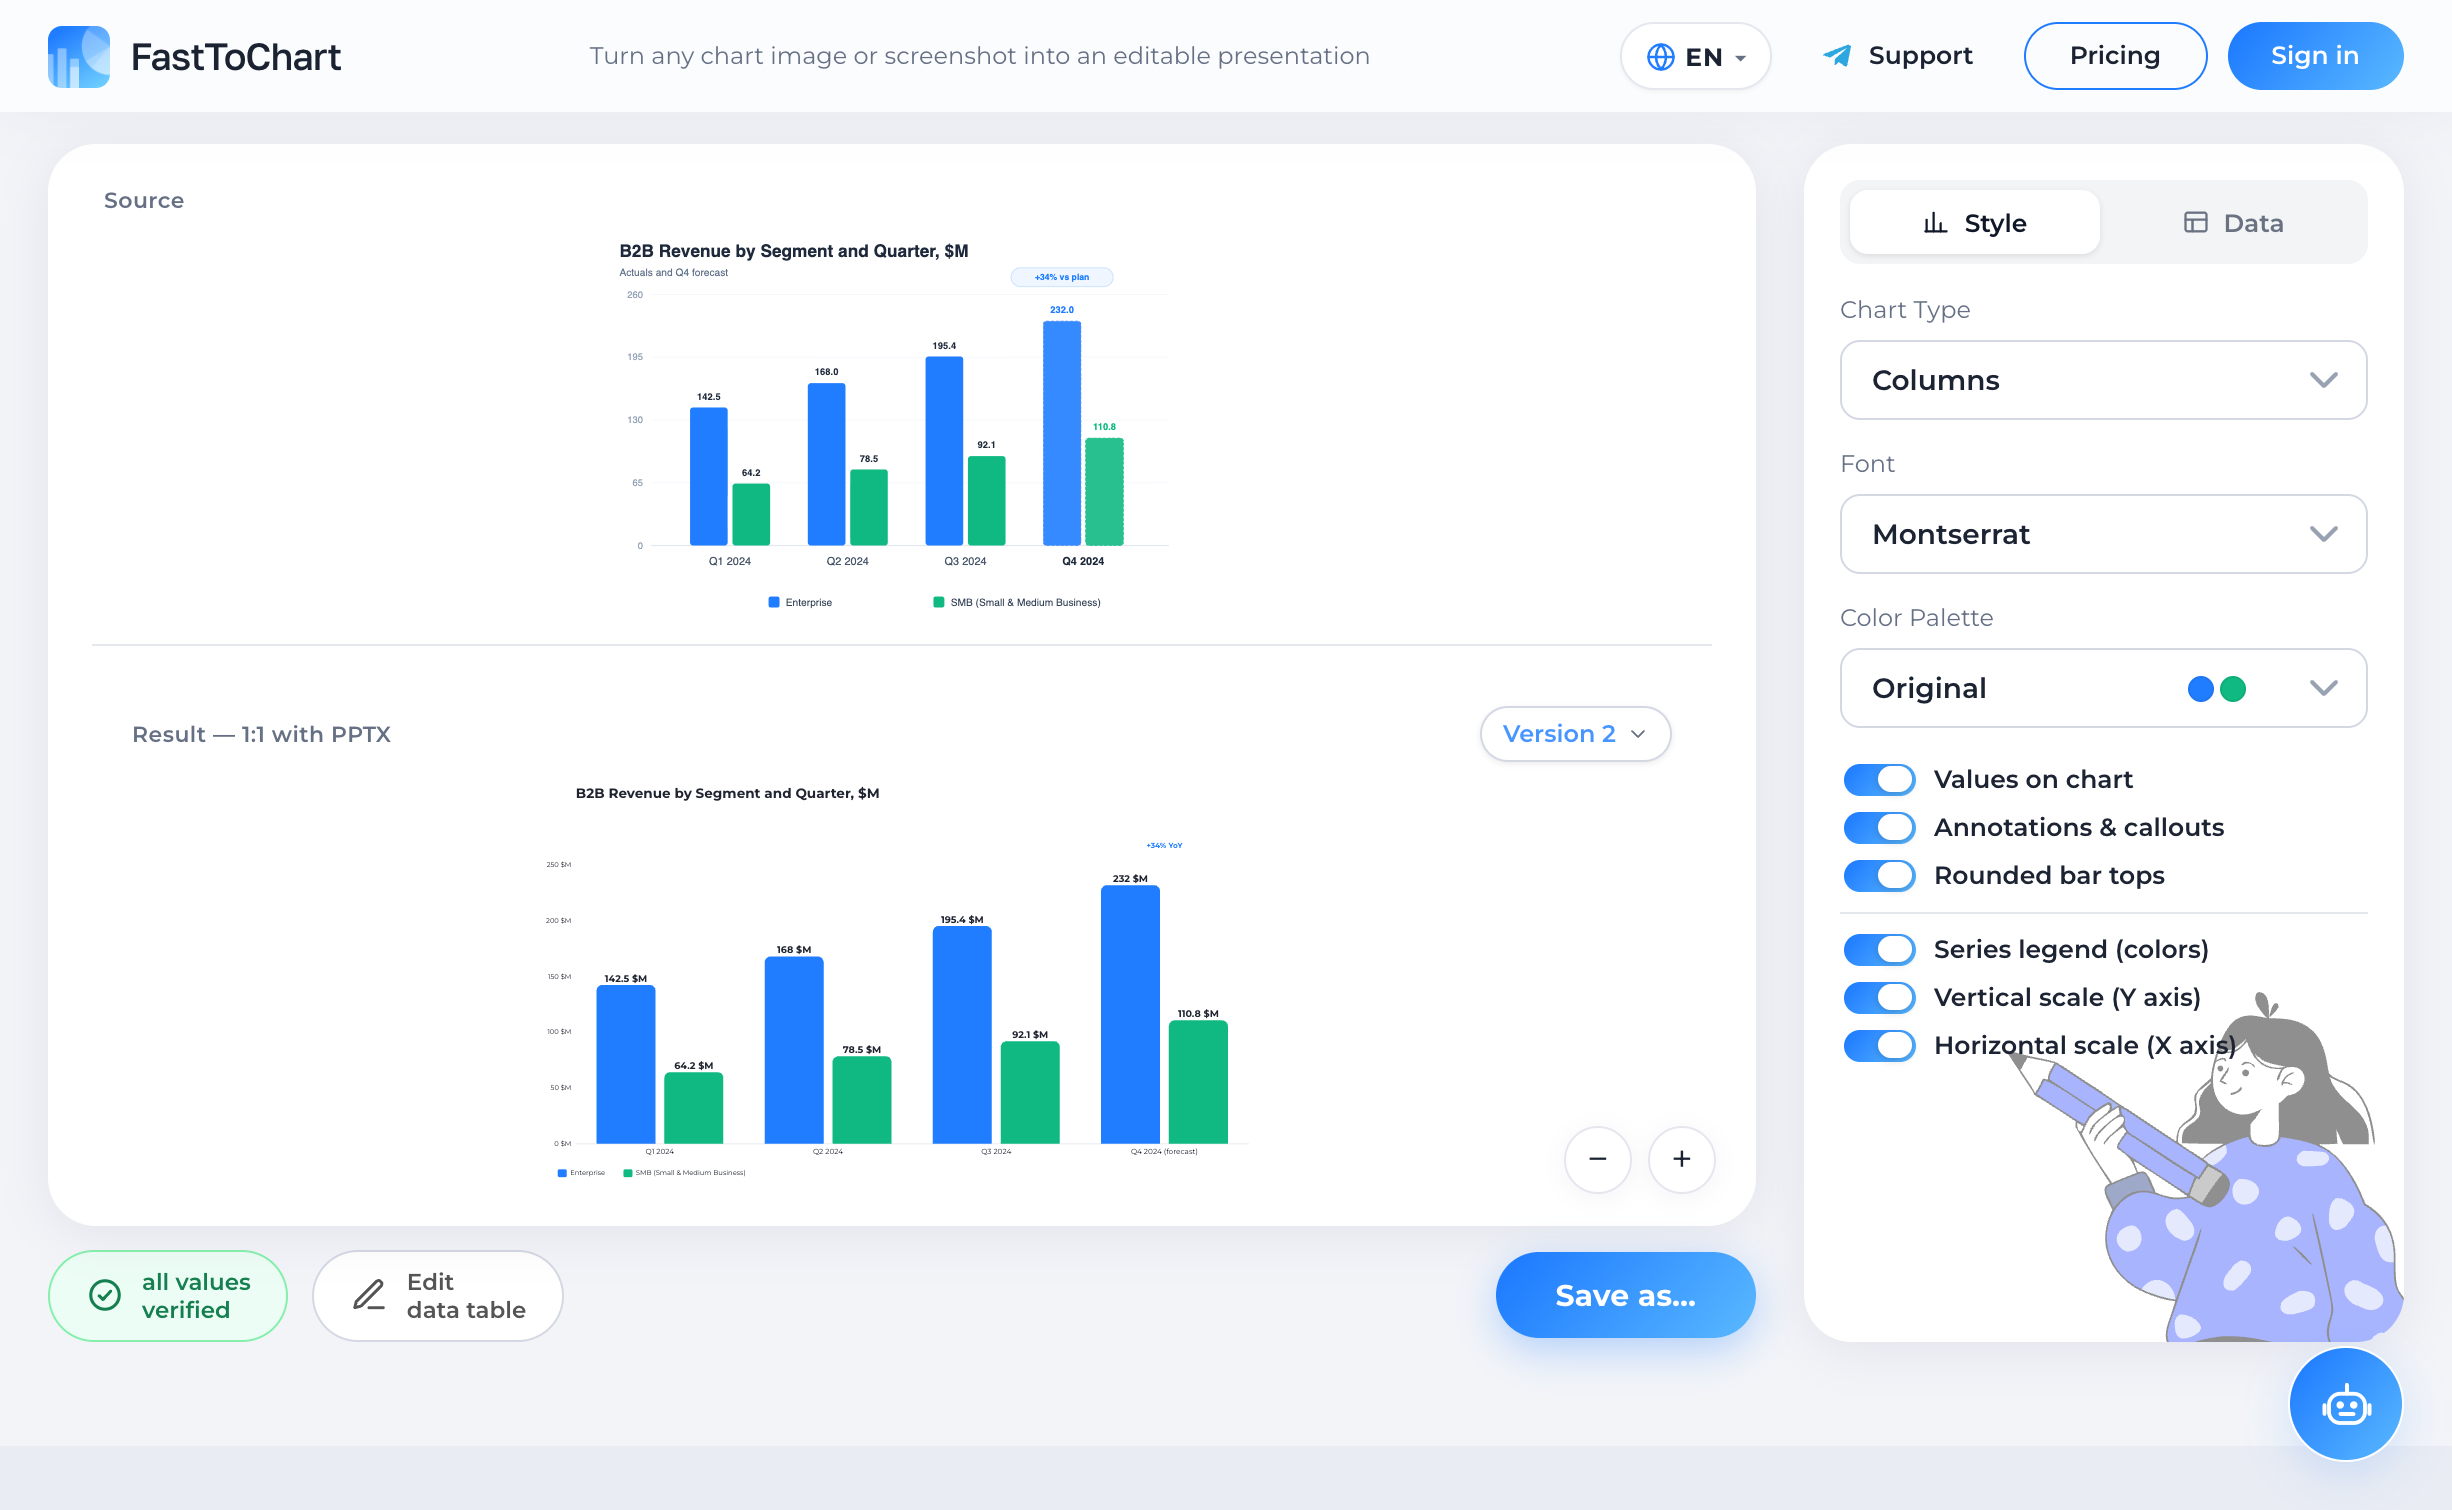
Verify extracted values, update numbers, and customize styling in a unified editor.
- Data table alongside your chart
- Colors and labels under your control
- Editable presentation-ready files
Supported Image Formats and Inputs
FastToChart works with virtually any visual input: report screenshots, presentation slide photos, scans from textbooks or research papers, whiteboards, and hand-drawn whiteboard sketches.
High-resolution images yield the highest precision. When value labels are printed directly on the bars or lines, FastToChart copies them verbatim. If numbers are not printed, values are measured against the axis scale with explicit confidence indicators.
Exact Style and Color Matching
Data extraction is only half the job: your reconstructed chart must look right in your final report or presentation deck. FastToChart samples hex colors directly from the original pixels, matches line thickness, bar corner roundings, gridlines, bounding frames, and legend positions.
We preserve the original aesthetic faithfully rather than imposing generic default templates over your data.
Interactive Verification & Zero-Risk Correction
No AI vision model offers 100% certainty across degraded images. FastToChart color-codes each cell by confidence: green for printed numbers verified with 100% certainty, and yellow for geometric estimates.
Click any cell in the built-in data table to adjust values instantly. The preview redraws in real time, and editing or exporting is always free.
Frequently Asked Questions
No, FastToChart runs entirely in your modern web browser. A lightweight Chrome extension is also available to digitize charts directly from any webpage.
Try it on your chart
Upload an image, presentation, or PDF — the first three recognitions are free, and editing data or exporting files is never metered.
Open tool