 FastToChart
Digitize Graphs & Plots Online with AI
Digitizing published scientific plots, academic papers, and benchmark charts used to require tedious manual clicking on every individual coordinate. FastToChart automates graph digitization with computer vision, extracting continuous curves and scatter points in seconds.
Upload chartHow it works
- 1Upload your plot screenshot, scanned research figure, or PDF chart.
- 2Computer vision detects axes, calibrated ranges, and samples data points.
- 3Inspect the extracted coordinates and download as CSV or Excel data.
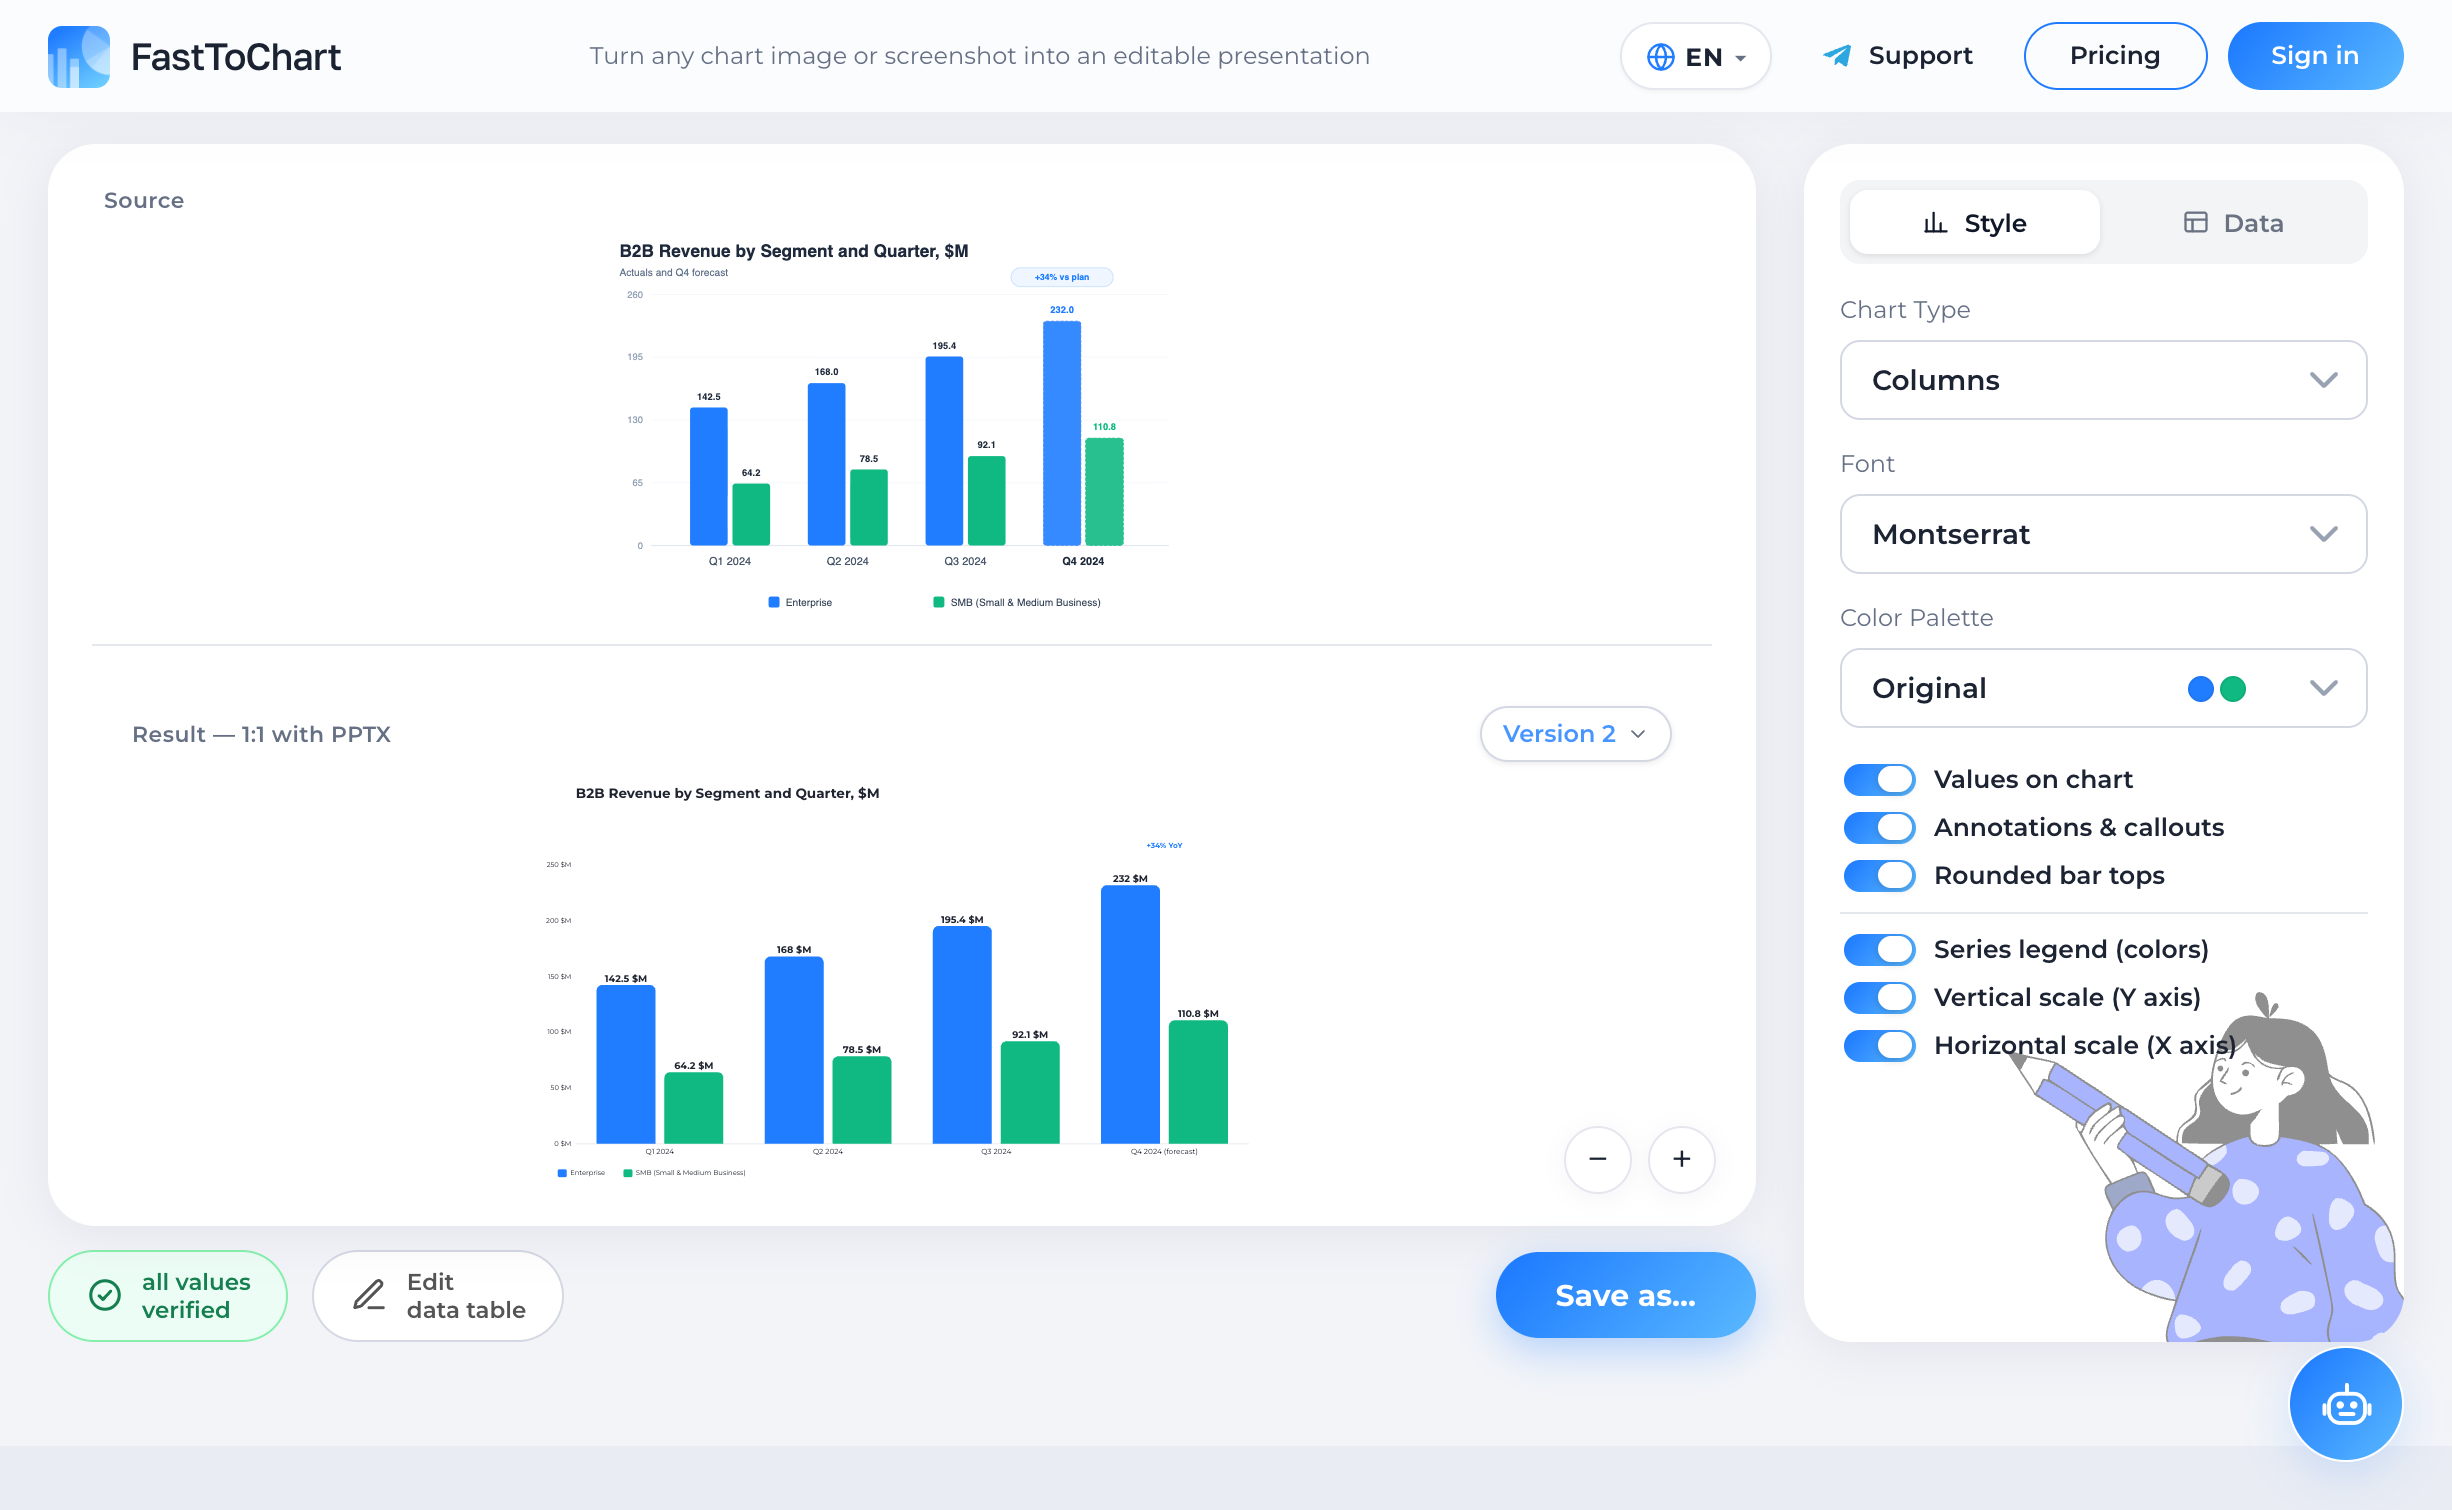
A chart you can work with
Verify extracted values, update numbers, and customize styling in a unified editor.
- Data table alongside your chart
- Colors and labels under your control
- Editable presentation-ready files
Automated Curve Sampling vs. Manual Clicking
Legacy plot digitizer software requires you to manually define X1, X2, Y1, Y2 calibration points, adjust color filters, and click hundreds of coordinates by hand. FastToChart replaces this entire manual process with intelligent neural perception.
For continuous mathematical curves and oscilloscope traces, our engine samples 40 to 80 points across the curve, tracking every peak, trough, and inflection point.
Scatter Plots and Bubble Clusters
Logarithmic and Dual Axis Support
Frequently Asked Questions
Yes. Simply take a screenshot of the figure or upload the PDF page. FastToChart reads plots directly from academic publications.
Try it on your chart
Upload an image, presentation, or PDF — the first three recognitions are free, and editing data or exporting files is never metered.
Open tool