 FastToChart
Online Chart Recognition & Graph Data Extraction
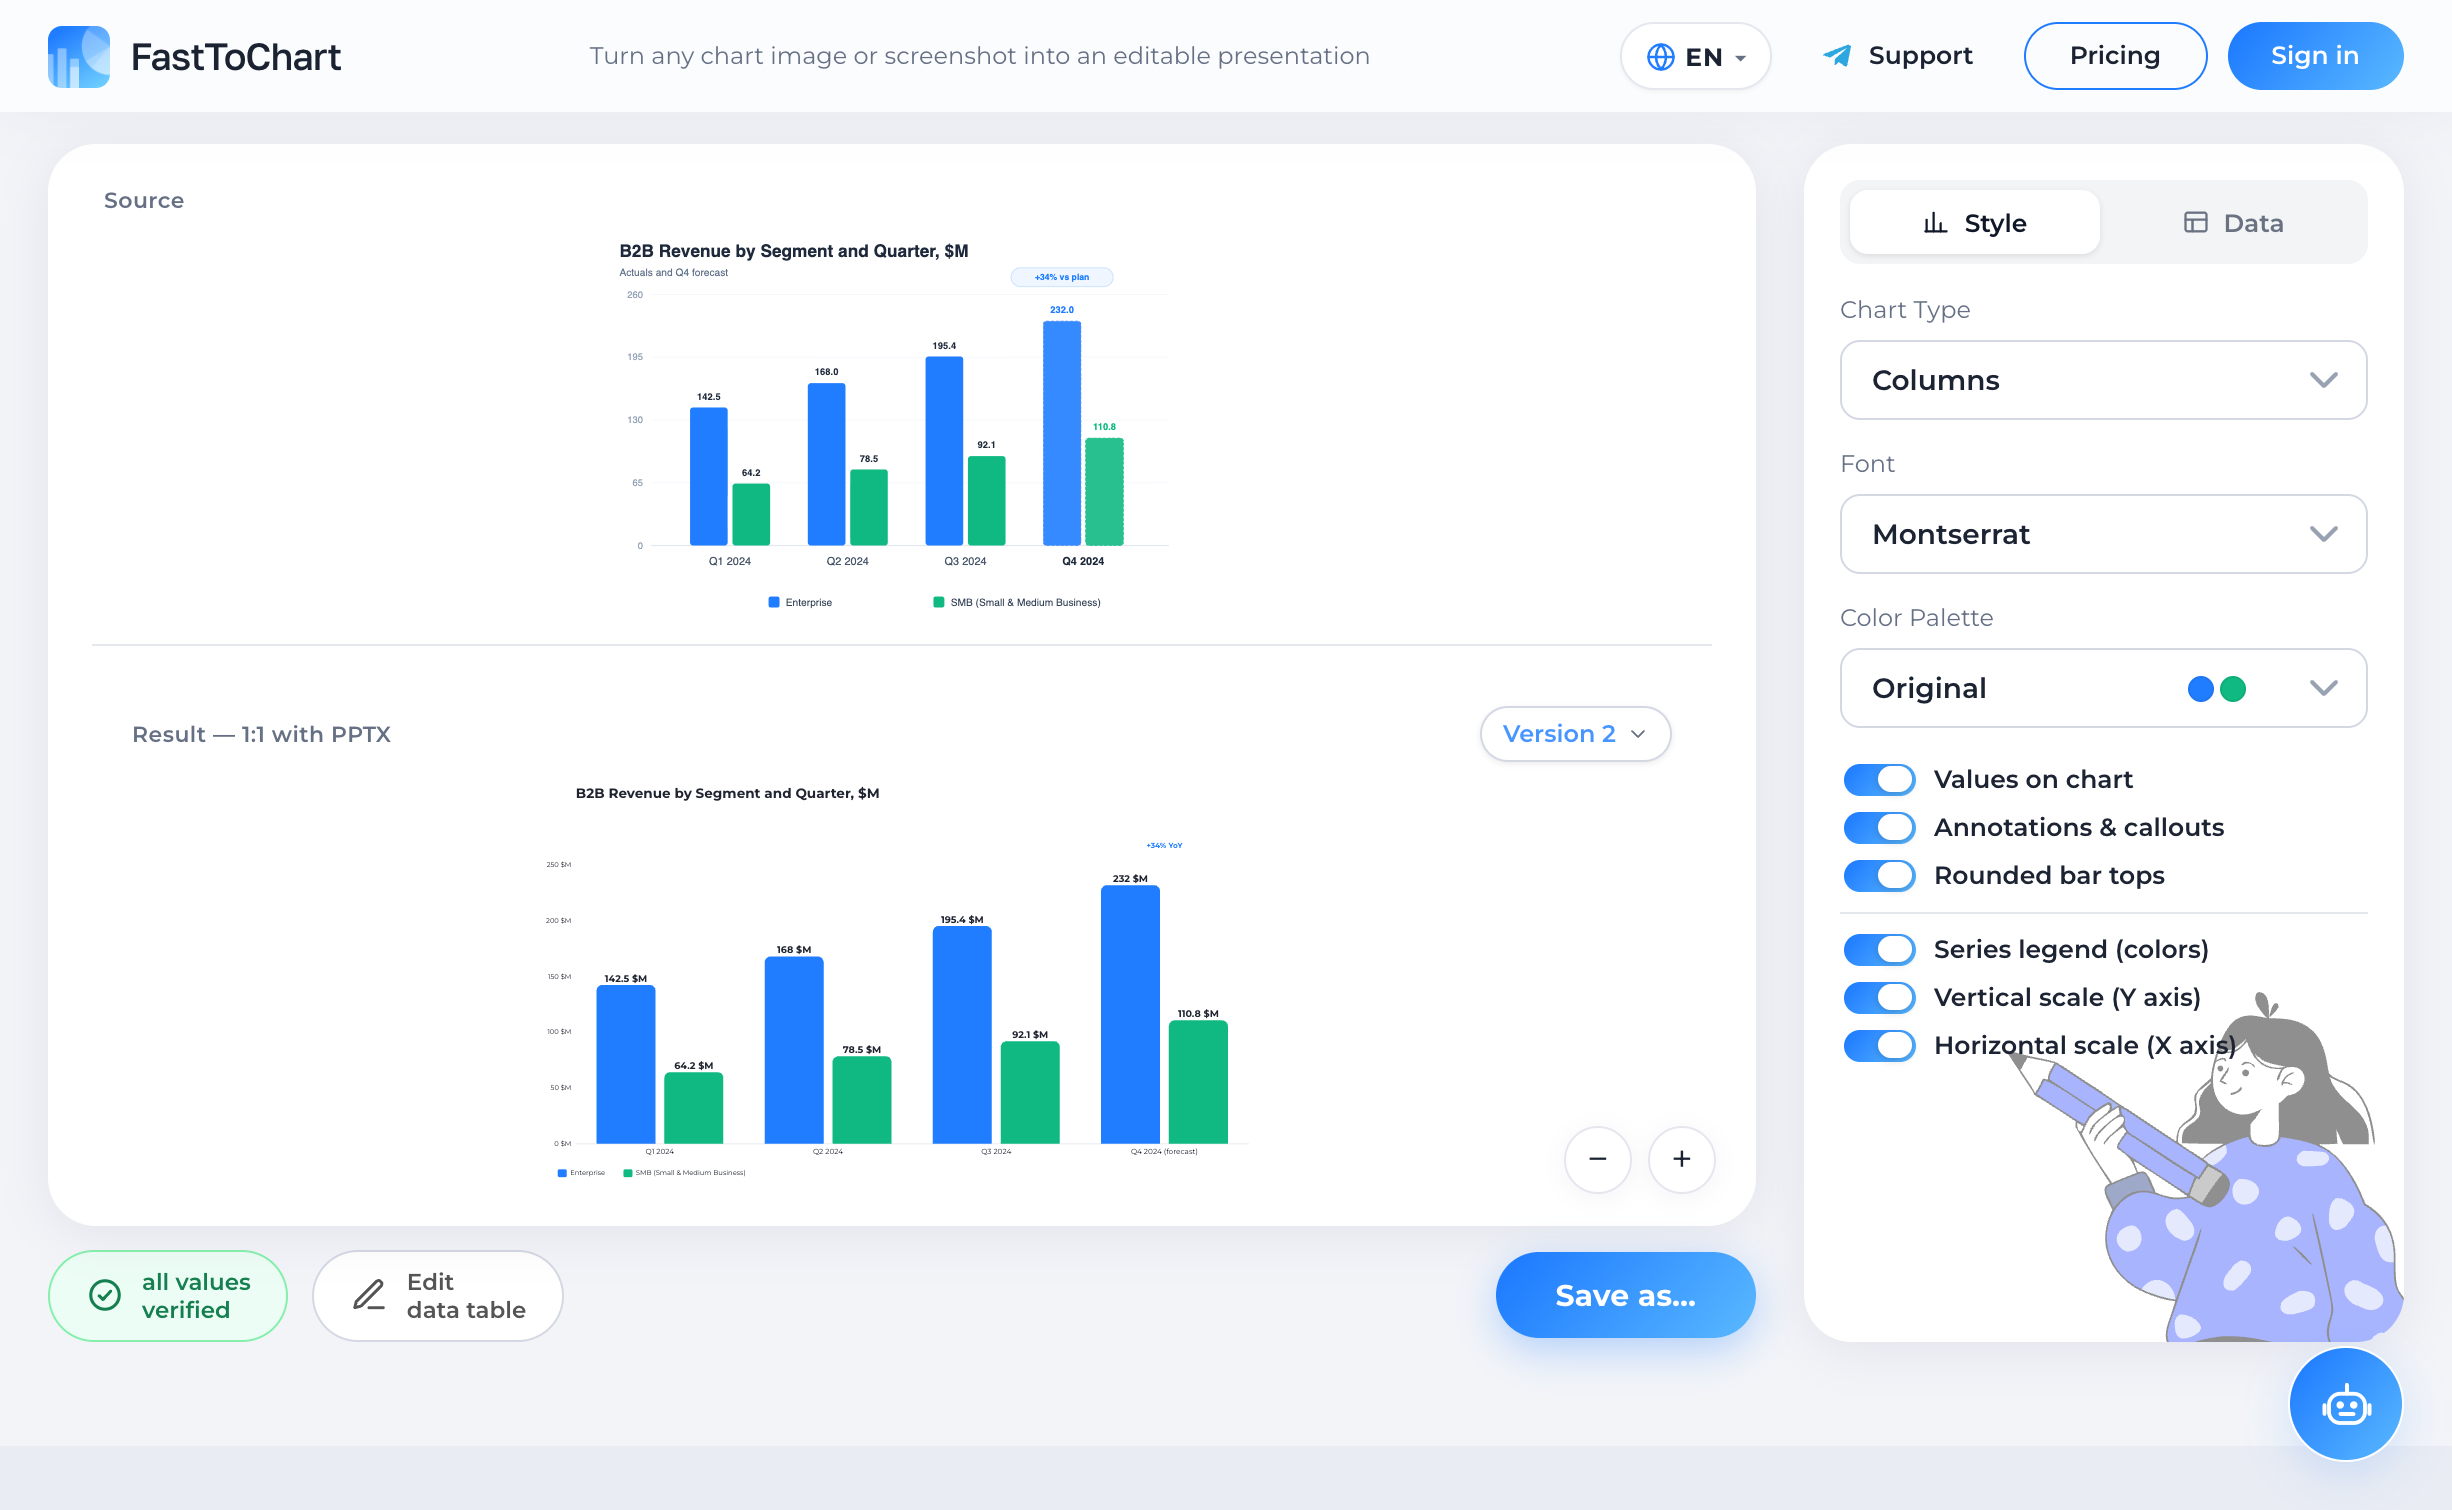
FastToChart uses advanced multimodal vision models to extract structured data from raster graphs. It recognizes chart architecture, numeric coordinates, legend items, axis labels, and color palettes automatically in seconds.
Upload chartHow it works
- 1Drop any chart image, scanned PDF page, or slide screenshot into the digitizer.
- 2The vision engine parses geometry, scales, categories, and per-series values.
- 3Review the structured data table and export to Excel (.xlsx) or PowerPoint (.pptx).
A chart you can work with
Verify extracted values, update numbers, and customize styling in a unified editor.
- Data table alongside your chart
- Colors and labels under your control
- Editable presentation-ready files
Comprehensive Extraction Capabilities
Traditional OCR reads only disconnected words. FastToChart understands chart syntax and spatial semantics, extracting complete relational datasets:
Handling Complex Multi-Series & Stacked Layouts
Real-world business and scientific charts are rarely simple single-line plots. FastToChart handles cumulative stacked bars where each segment belongs to a separate series, plan vs. actual comparisons, and combo charts with secondary percentage axes.
Stack ordering is maintained from bottom to top so that your exported PowerPoint slide preserves the exact structural narrative of the original.
Strict Truthfulness Over Generative Hallucination
Frequently Asked Questions
Manual data entry takes 10 to 20 minutes per complex chart and suffers from transcription errors. FastToChart digitizes entire multi-series charts in 3–5 seconds with automatic verification.
Try it on your chart
Upload an image, presentation, or PDF — the first three recognitions are free, and editing data or exporting files is never metered.
Open tool