 FastToChart
Convert Gantt Charts and Project Timelines from Images
Project roadmaps, release schedules, and Gantt charts frequently become trapped in static screenshots within PDFs and executive decks. FastToChart extracts task hierarchies, calendar durations, start and end dates, milestones, and assignees, rebuilding them into structured Excel schedules and editable PowerPoint slides.
Upload chartHow it works
- 1Upload your Gantt chart image, roadmap screenshot, or PDF project plan.
- 2FastToChart calibrates the calendar timeline, extracts task bars, and reads milestone markers.
- 3Download a structured task spreadsheet in Excel (.xlsx) or an editable PowerPoint presentation timeline.
A chart you can work with
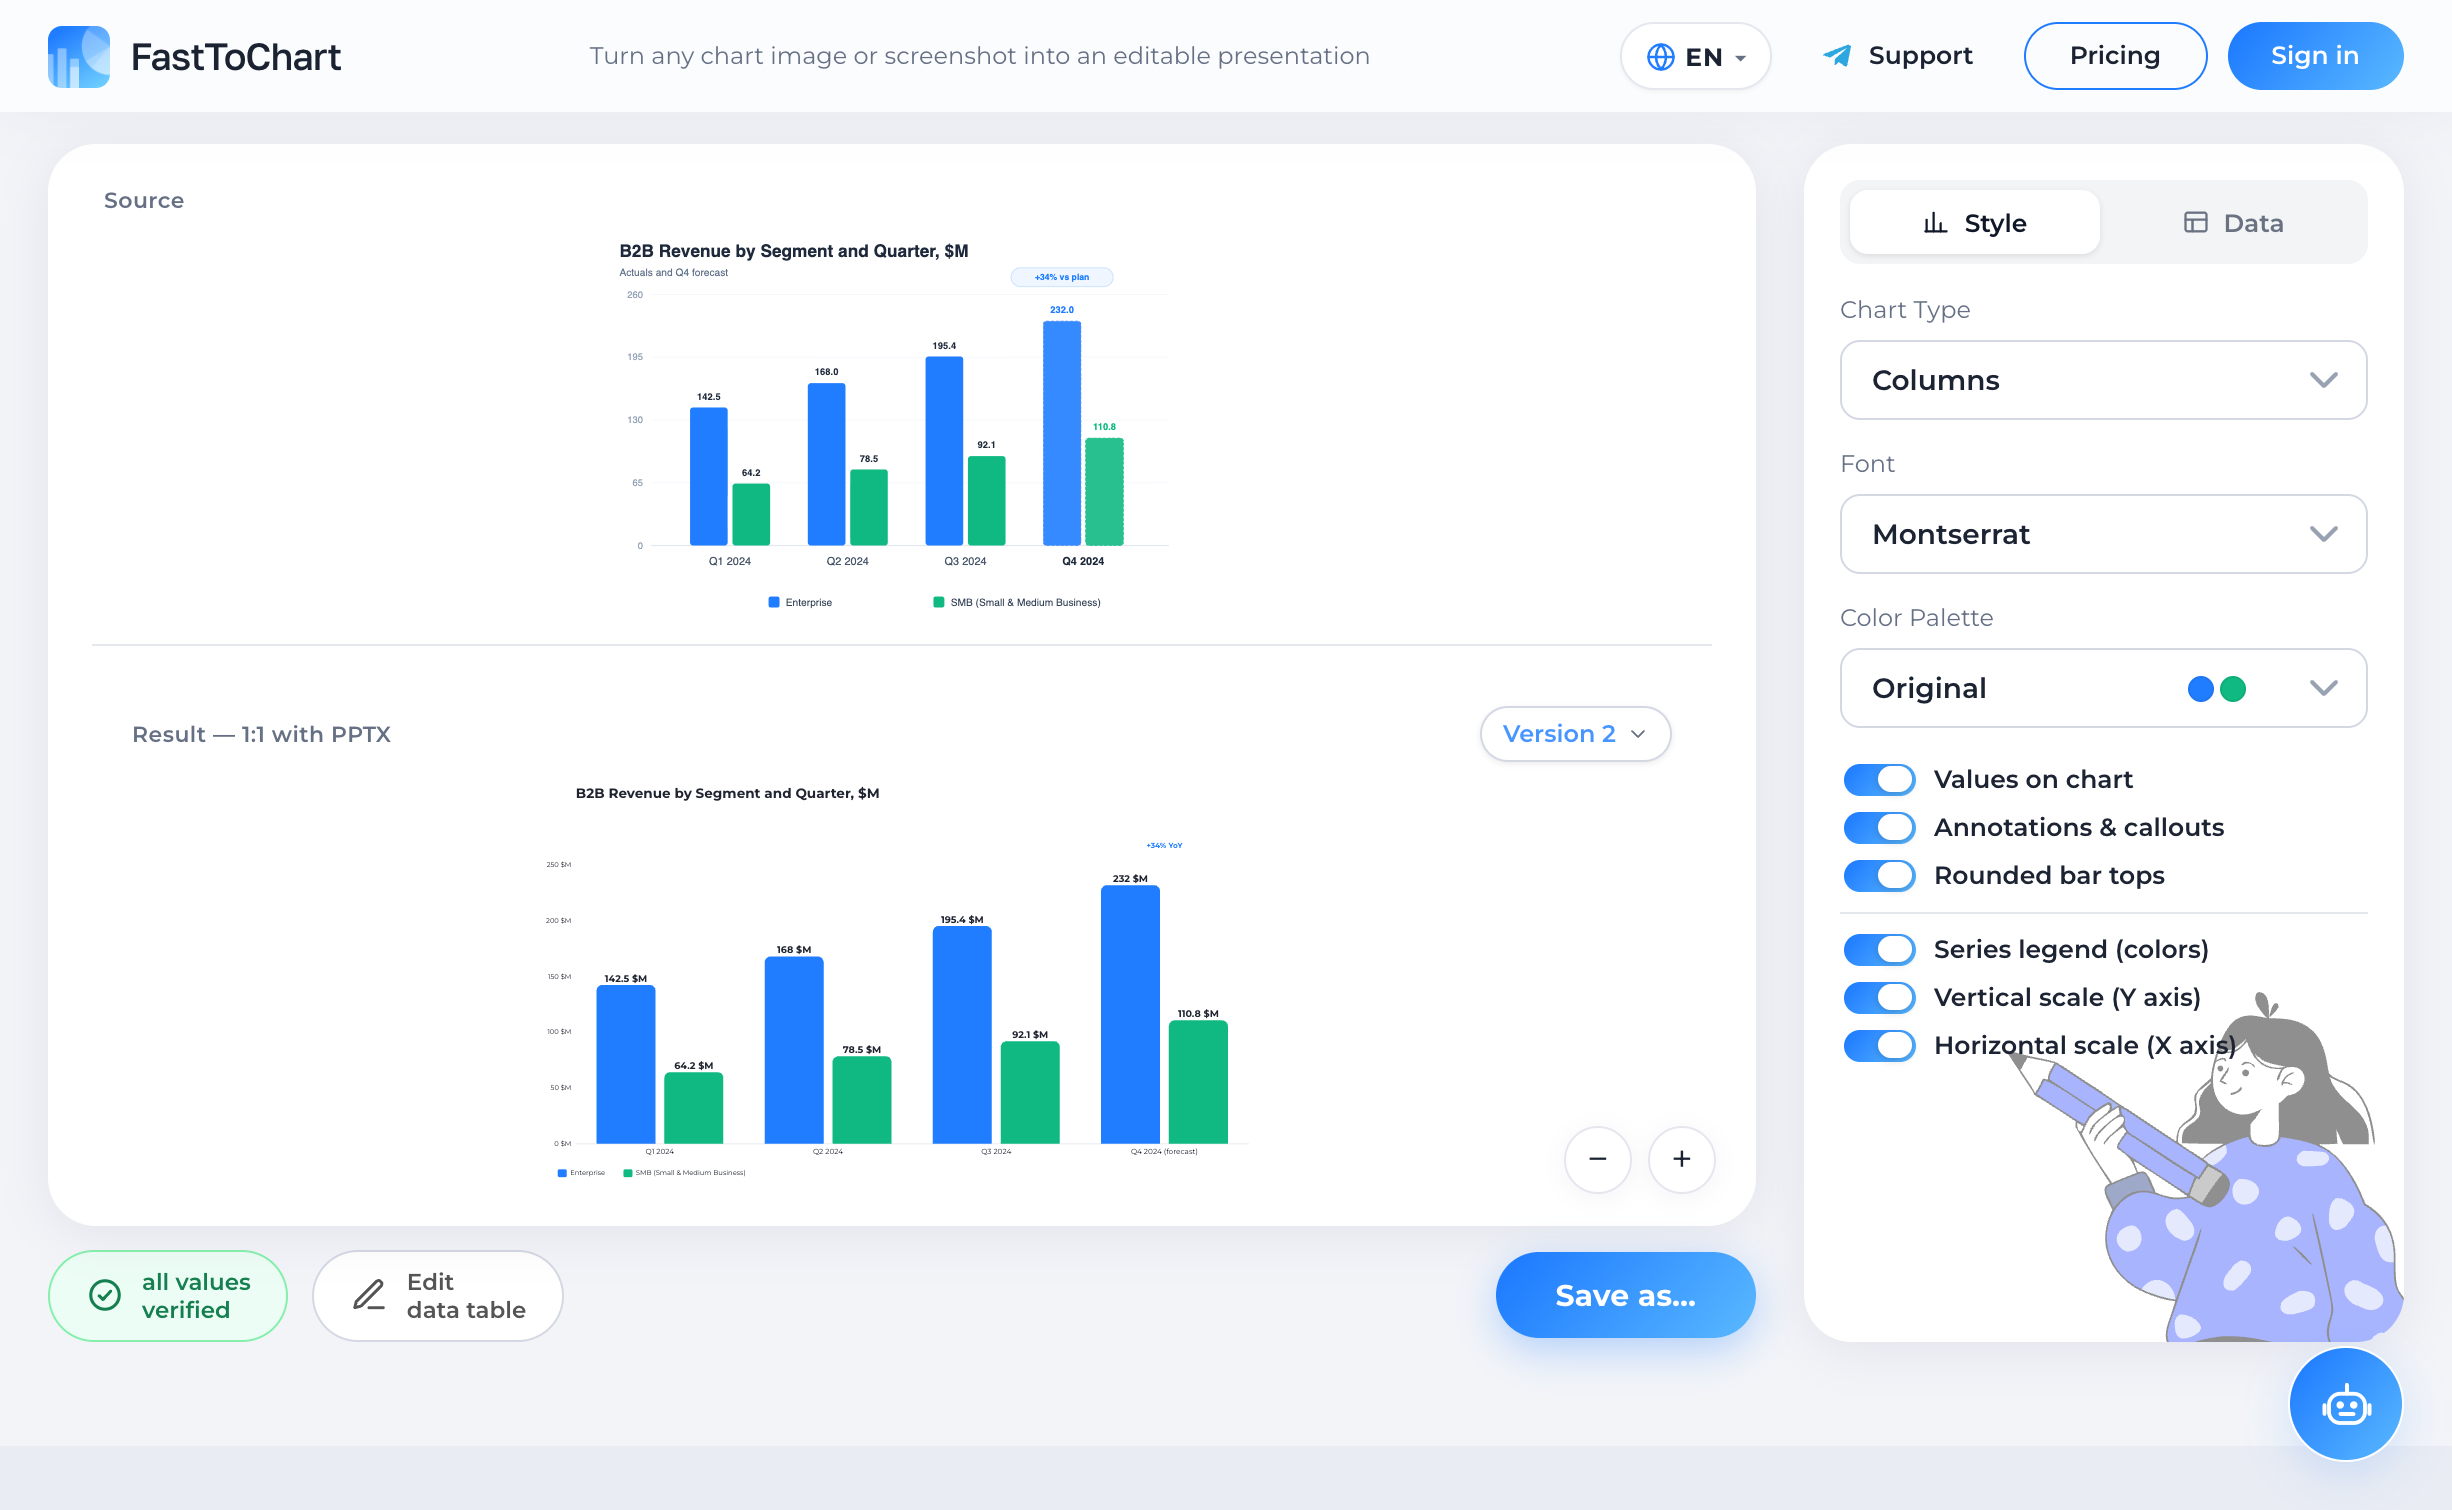
Verify extracted values, update numbers, and customize styling in a unified editor.
- Data table alongside your chart
- Colors and labels under your control
- Editable presentation-ready files
Understanding the Chart and Structure
A Gantt chart is a specialized horizontal bar graph designed for project management, program tracking, and resource allocation. It plots work breakdown structure (WBS) tasks along the vertical Y-axis against a chronological calendar time scale on the horizontal X-axis.
Project managers, management consultants, and engineering leaders rely on Gantt timelines to illustrate project phases, identify critical path bottlenecks, monitor overlapping dependencies, and report milestone deliverables to executive stakeholders.
Anatomy and Key Components
Gantt charts combine multiple distinct visual and temporal elements that FastToChart identifies and separates into structured data fields:
Why Manual Extraction Fails
When a Gantt chart screenshot is embedded in a PDF or slide, updating it is painful. Moving a project deadline by two weeks requires manually re-measuring pixels, dragging horizontal shape boxes, adjusting text labels, and recalculating overlapping dependencies. In complex projects with dozens of tasks, this manual realignment takes hours.
Exporting data from an image into Microsoft Project, Jira, or Excel is impossible without tedious manual data entry. FastToChart automatically translates horizontal bar spans into authentic calendar dates and durations, delivering a ready-to-import spreadsheet and an editable presentation timeline in seconds.
Data Verification Best Practices
Frequently Asked Questions
Yes. Start and end boundaries are calibrated against the calendar axis and output as structured date entries ready for formulas.
Try it on your chart
Upload an image, presentation, or PDF — the first three recognitions are free, and editing data or exporting files is never metered.
Open tool