 FastToChart
Create Presentation-Ready Charts from Tables
Turn raw spreadsheet tables into executive-ready presentation charts in seconds. Upload an Excel workbook or paste a data table, describe what you need in plain English, and get an editable PowerPoint chart ready for your meeting.
Upload chartChart Image
Sales TrendEditable
Data24353050
PowerPoint · Excel · CSV · PNG
Any sourceImage, PDF, or presentation
Your data & styleCustomize numbers, labels, and colors
Ready to workExport to PowerPoint, Excel, CSV, and PNG
How it works
- 1Paste table rows or upload an Excel (.xlsx) or CSV spreadsheet.
- 2Type a brief prompt (e.g. 'Build a quarterly revenue bar chart with % growth on secondary axis').
- 3Get an instant interactive chart and export directly to PowerPoint, Excel, or PNG.
From image to data
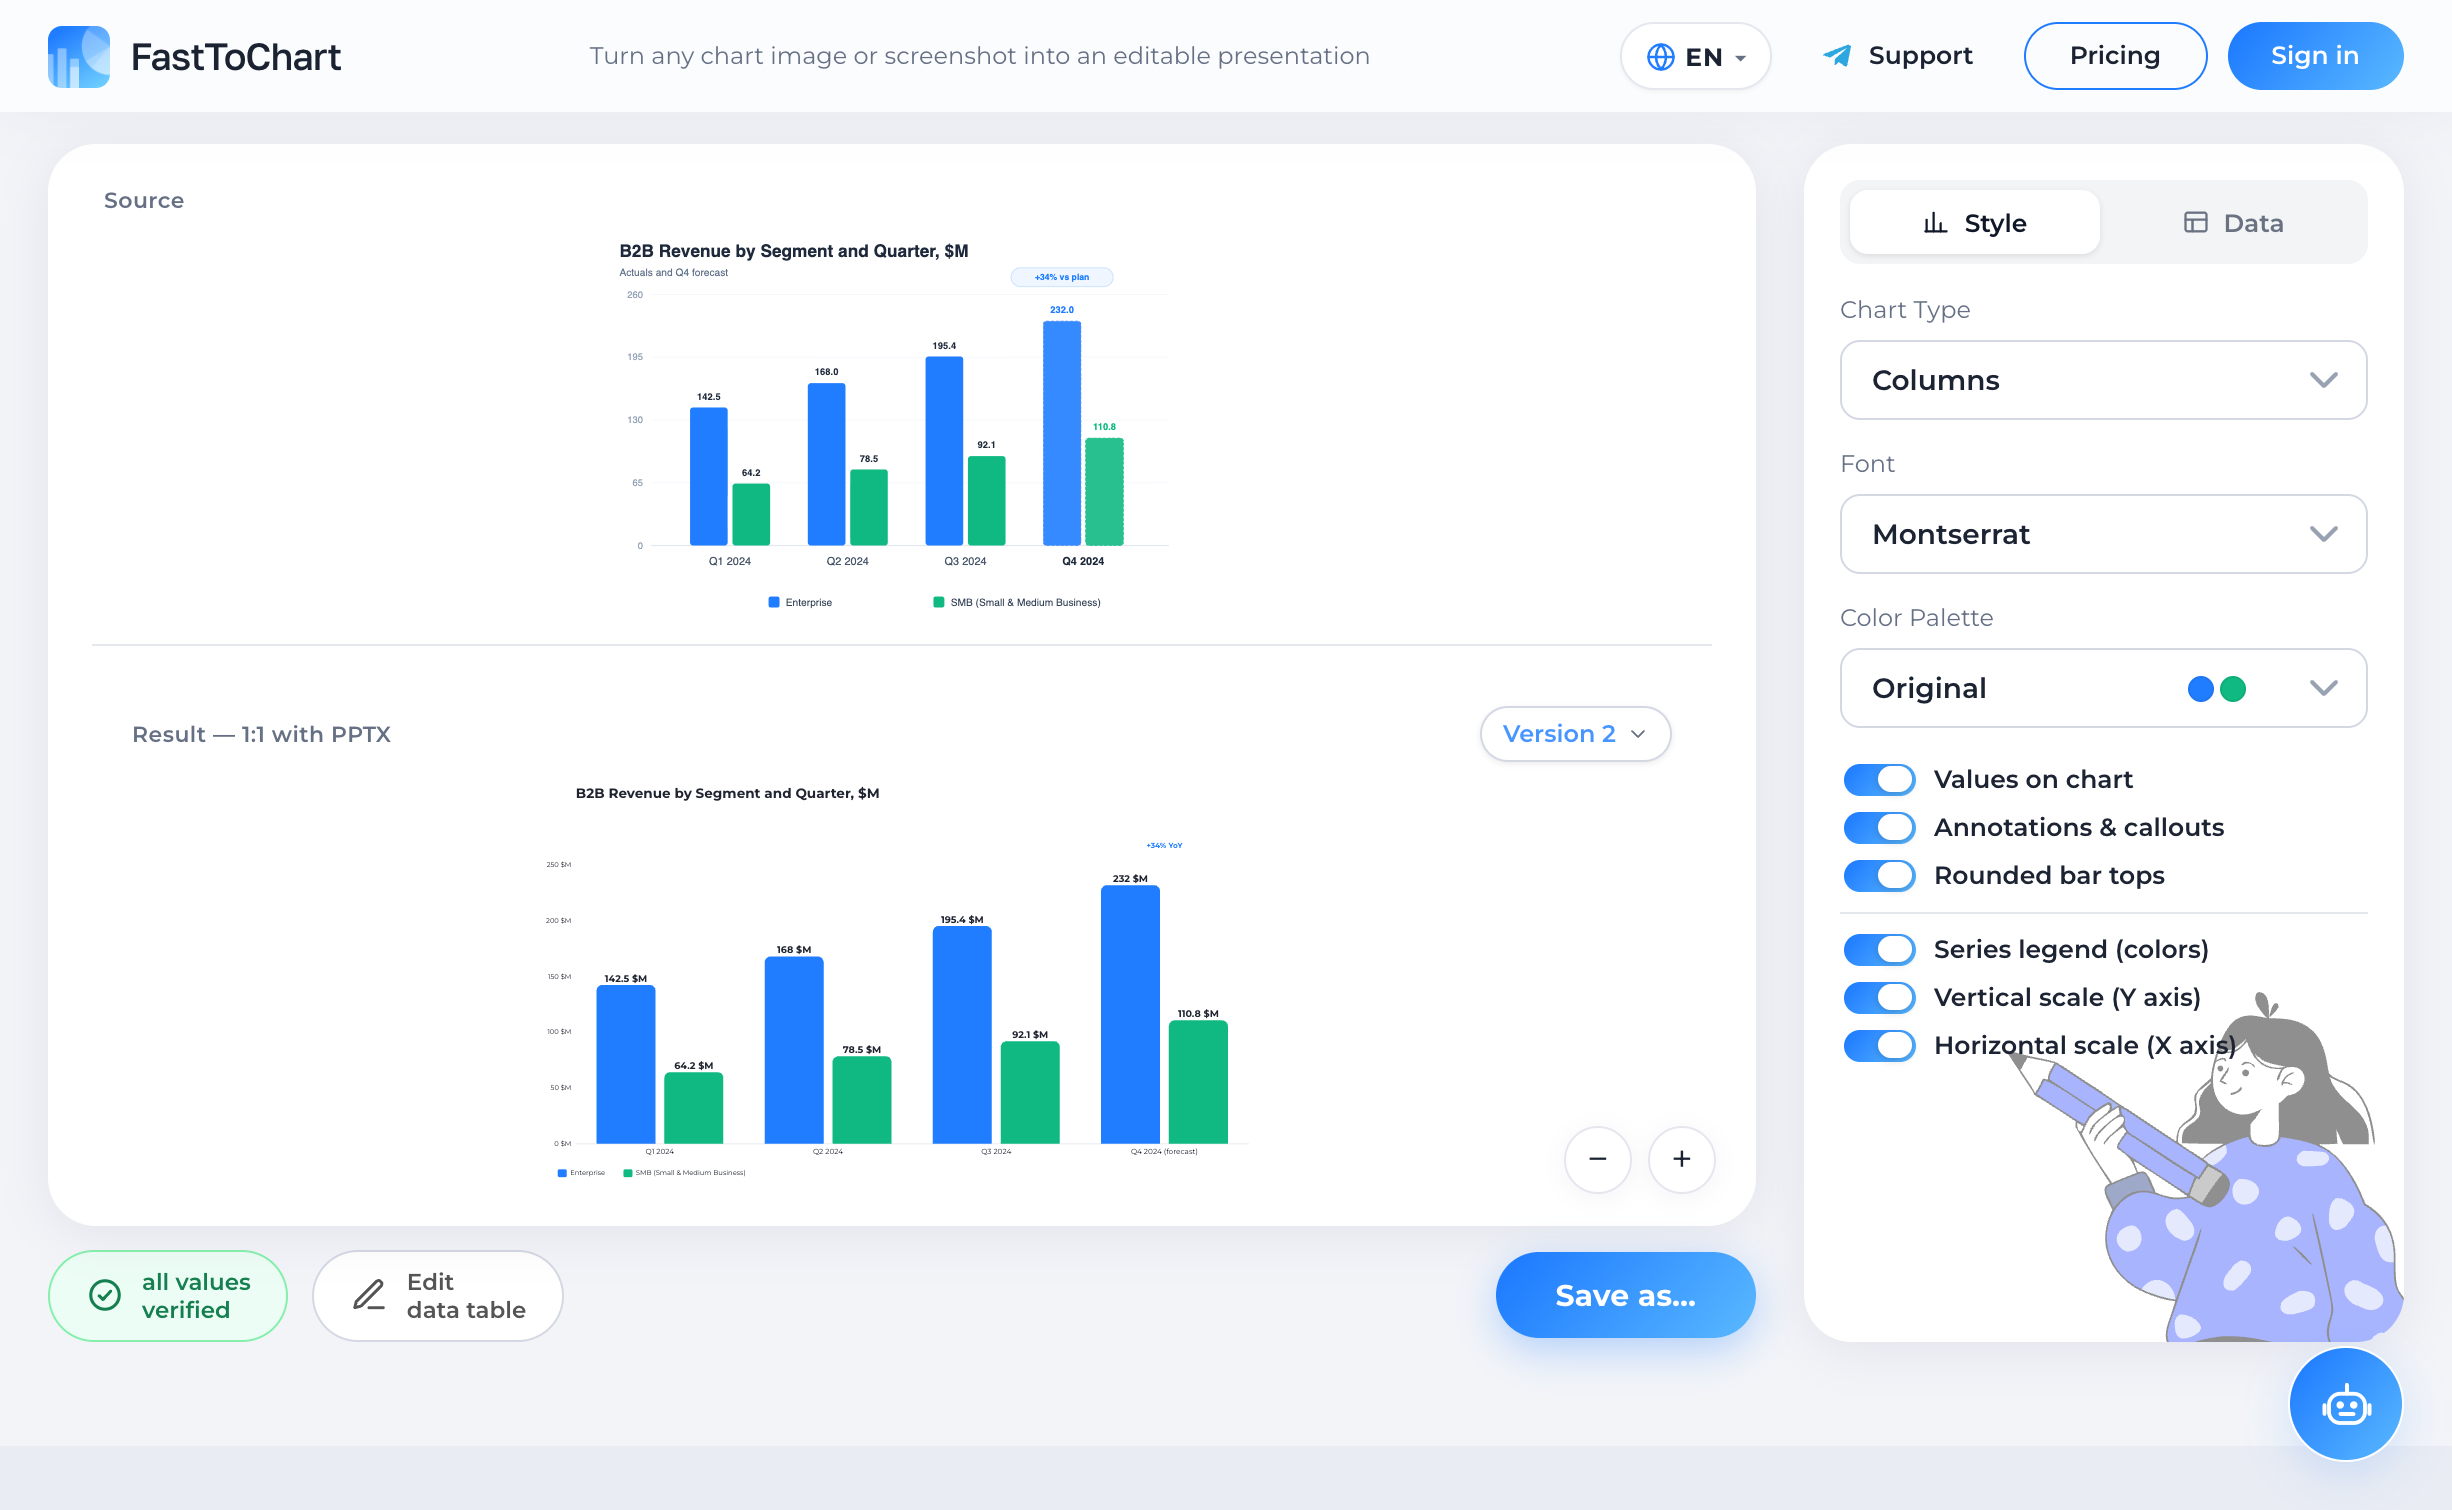
A chart you can work with
Verify extracted values, update numbers, and customize styling in a unified editor.
- Data table alongside your chart
- Colors and labels under your control
- Editable presentation-ready files
Natural Language Chart Design
Intelligent Table Parsing
Executive Design Standards
Frequently Asked Questions
Yes. You can instruct FastToChart in plain English: 'Plot only columns 1, 3, and 5 and exclude Total'.
Try it on your chart
Upload an image, presentation, or PDF — the first three recognitions are free, and editing data or exporting files is never metered.
Open tool