 FastToChart
Best Graph Digitizer Software & Tools: 2026 Review
Looking for the best way to extract numbers and curves from image graphs? We reviewed and compared the leading graph digitizer software solutions: from traditional manual calibration utilities to automated AI engines.
Upload chartHow it works
- 1Select the tool that best fits your workflow (manual scientific clicking vs. automated AI extraction).
- 2Upload your chart image or PDF figure.
- 3Export extracted data points to Excel, CSV, or PowerPoint.
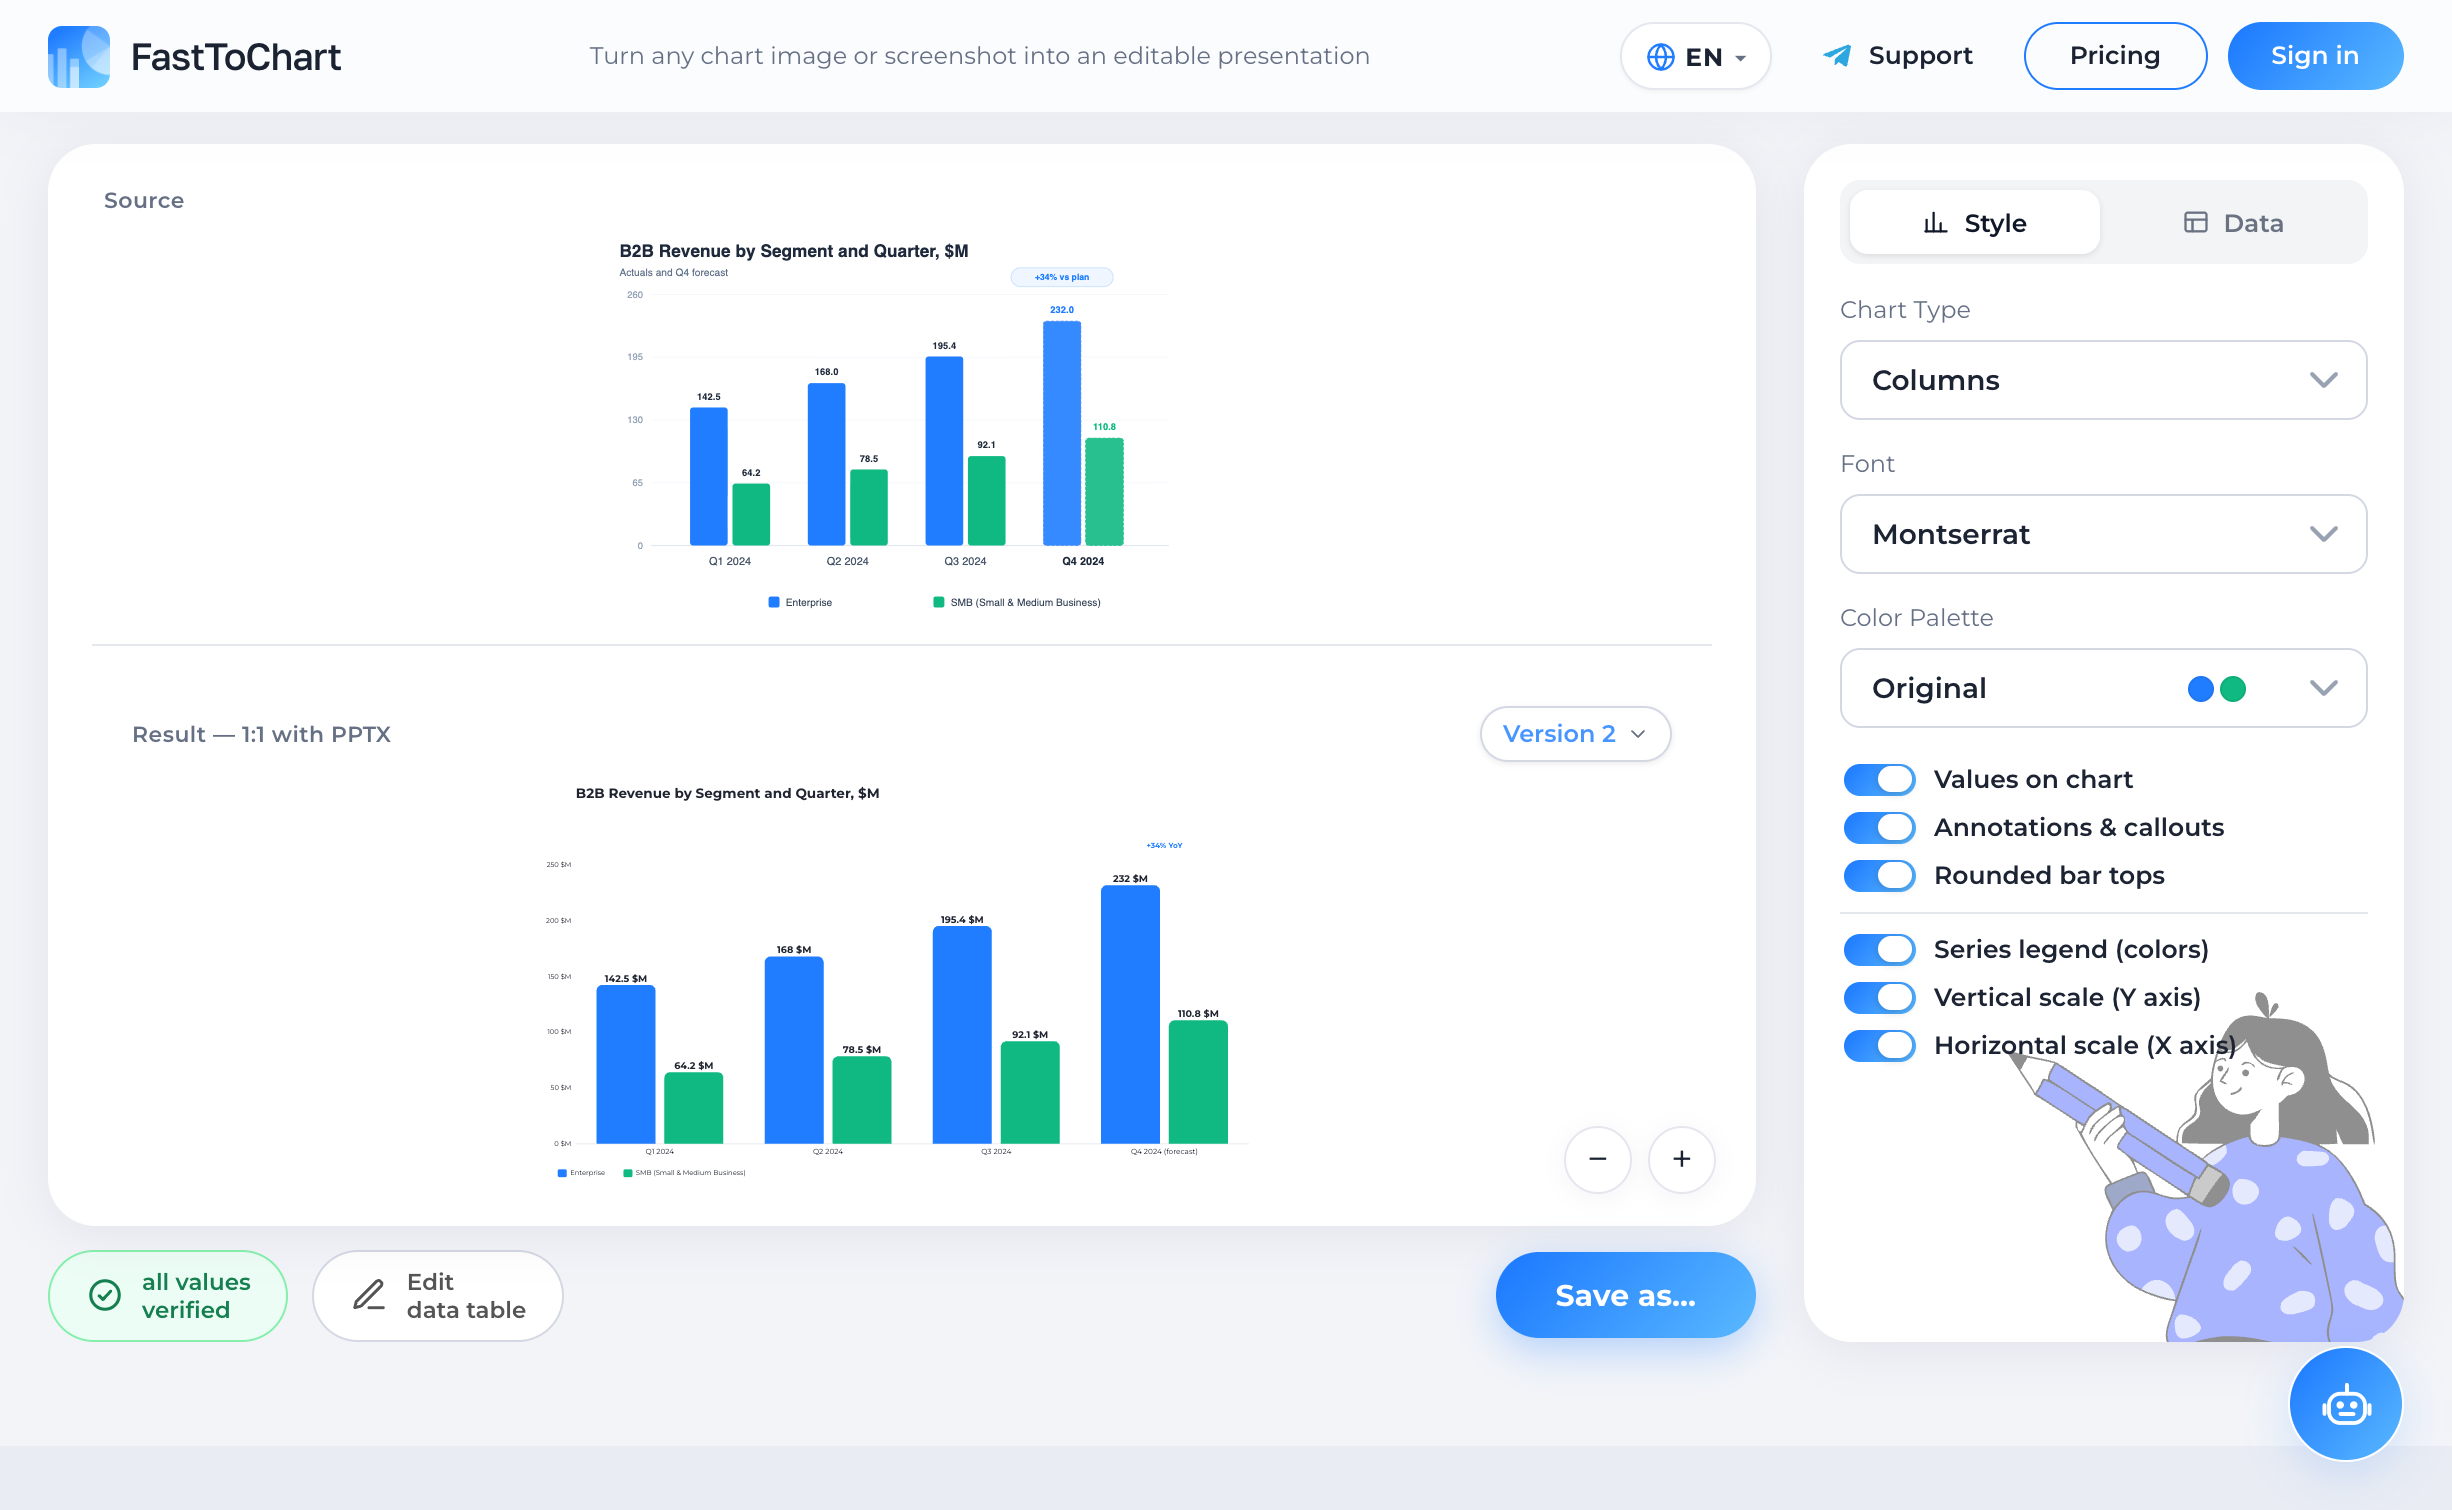
A chart you can work with
Verify extracted values, update numbers, and customize styling in a unified editor.
- Data table alongside your chart
- Colors and labels under your control
- Editable presentation-ready files
Top Graph Digitizer Tools Compared
Choosing the right graph digitizer depends on your volume, chart types, and need for speed. Here is how the top tools stack up:
| Tool | Technology | Speed | Best For | PowerPoint Export |
|---|---|---|---|---|
| FastToChart | AI Vision Engine | 3–5 seconds | Business, financial, & scientific charts | Native .pptx & .xlsx |
| WebPlotDigitizer | Manual calibration | 3–10 minutes | Academic research & specialized coordinate systems | CSV / JSON only |
| PlotDigitizer | Semi-manual | 2–5 minutes | 2D curves & engineering plots | CSV only |
| Engauge Digitizer | Desktop open-source | 5–15 minutes | Offline local scientific analysis | Text export only |
| Manual Re-typing | Human eyeball | 15–30 minutes | Simple 3-item charts | Manual build |
Reviewed in August 2026 based on feature completeness and usability.
1. FastToChart — Best Overall for Speed and Presentation Export
2. WebPlotDigitizer — Best for Complex Specialized Coordinates
3. PlotDigitizer — Solid Classic Online Tool
Frequently Asked Questions
FastToChart is the fastest solution because it completely automates axis detection, series mapping, and PowerPoint slide generation in 3–5 seconds.
Try it on your chart
Upload an image, presentation, or PDF — the first three recognitions are free, and editing data or exporting files is never metered.
Open tool