 FastToChart
Extract Data from Chart Screenshots into Excel Online
When someone sends a picture of a graph without the underlying spreadsheet, extracting numbers by hand is slow and error-prone. FastToChart converts chart images directly into clean, structured Excel worksheets and CSV files.
Upload chartHow it works
- 1Upload or paste your chart image, screenshot, or PDF page.
- 2AI identifies categories along the axis and reads all series values.
- 3Download an organized .xlsx spreadsheet with columns for categories and series ready for calculations.
A chart you can work with
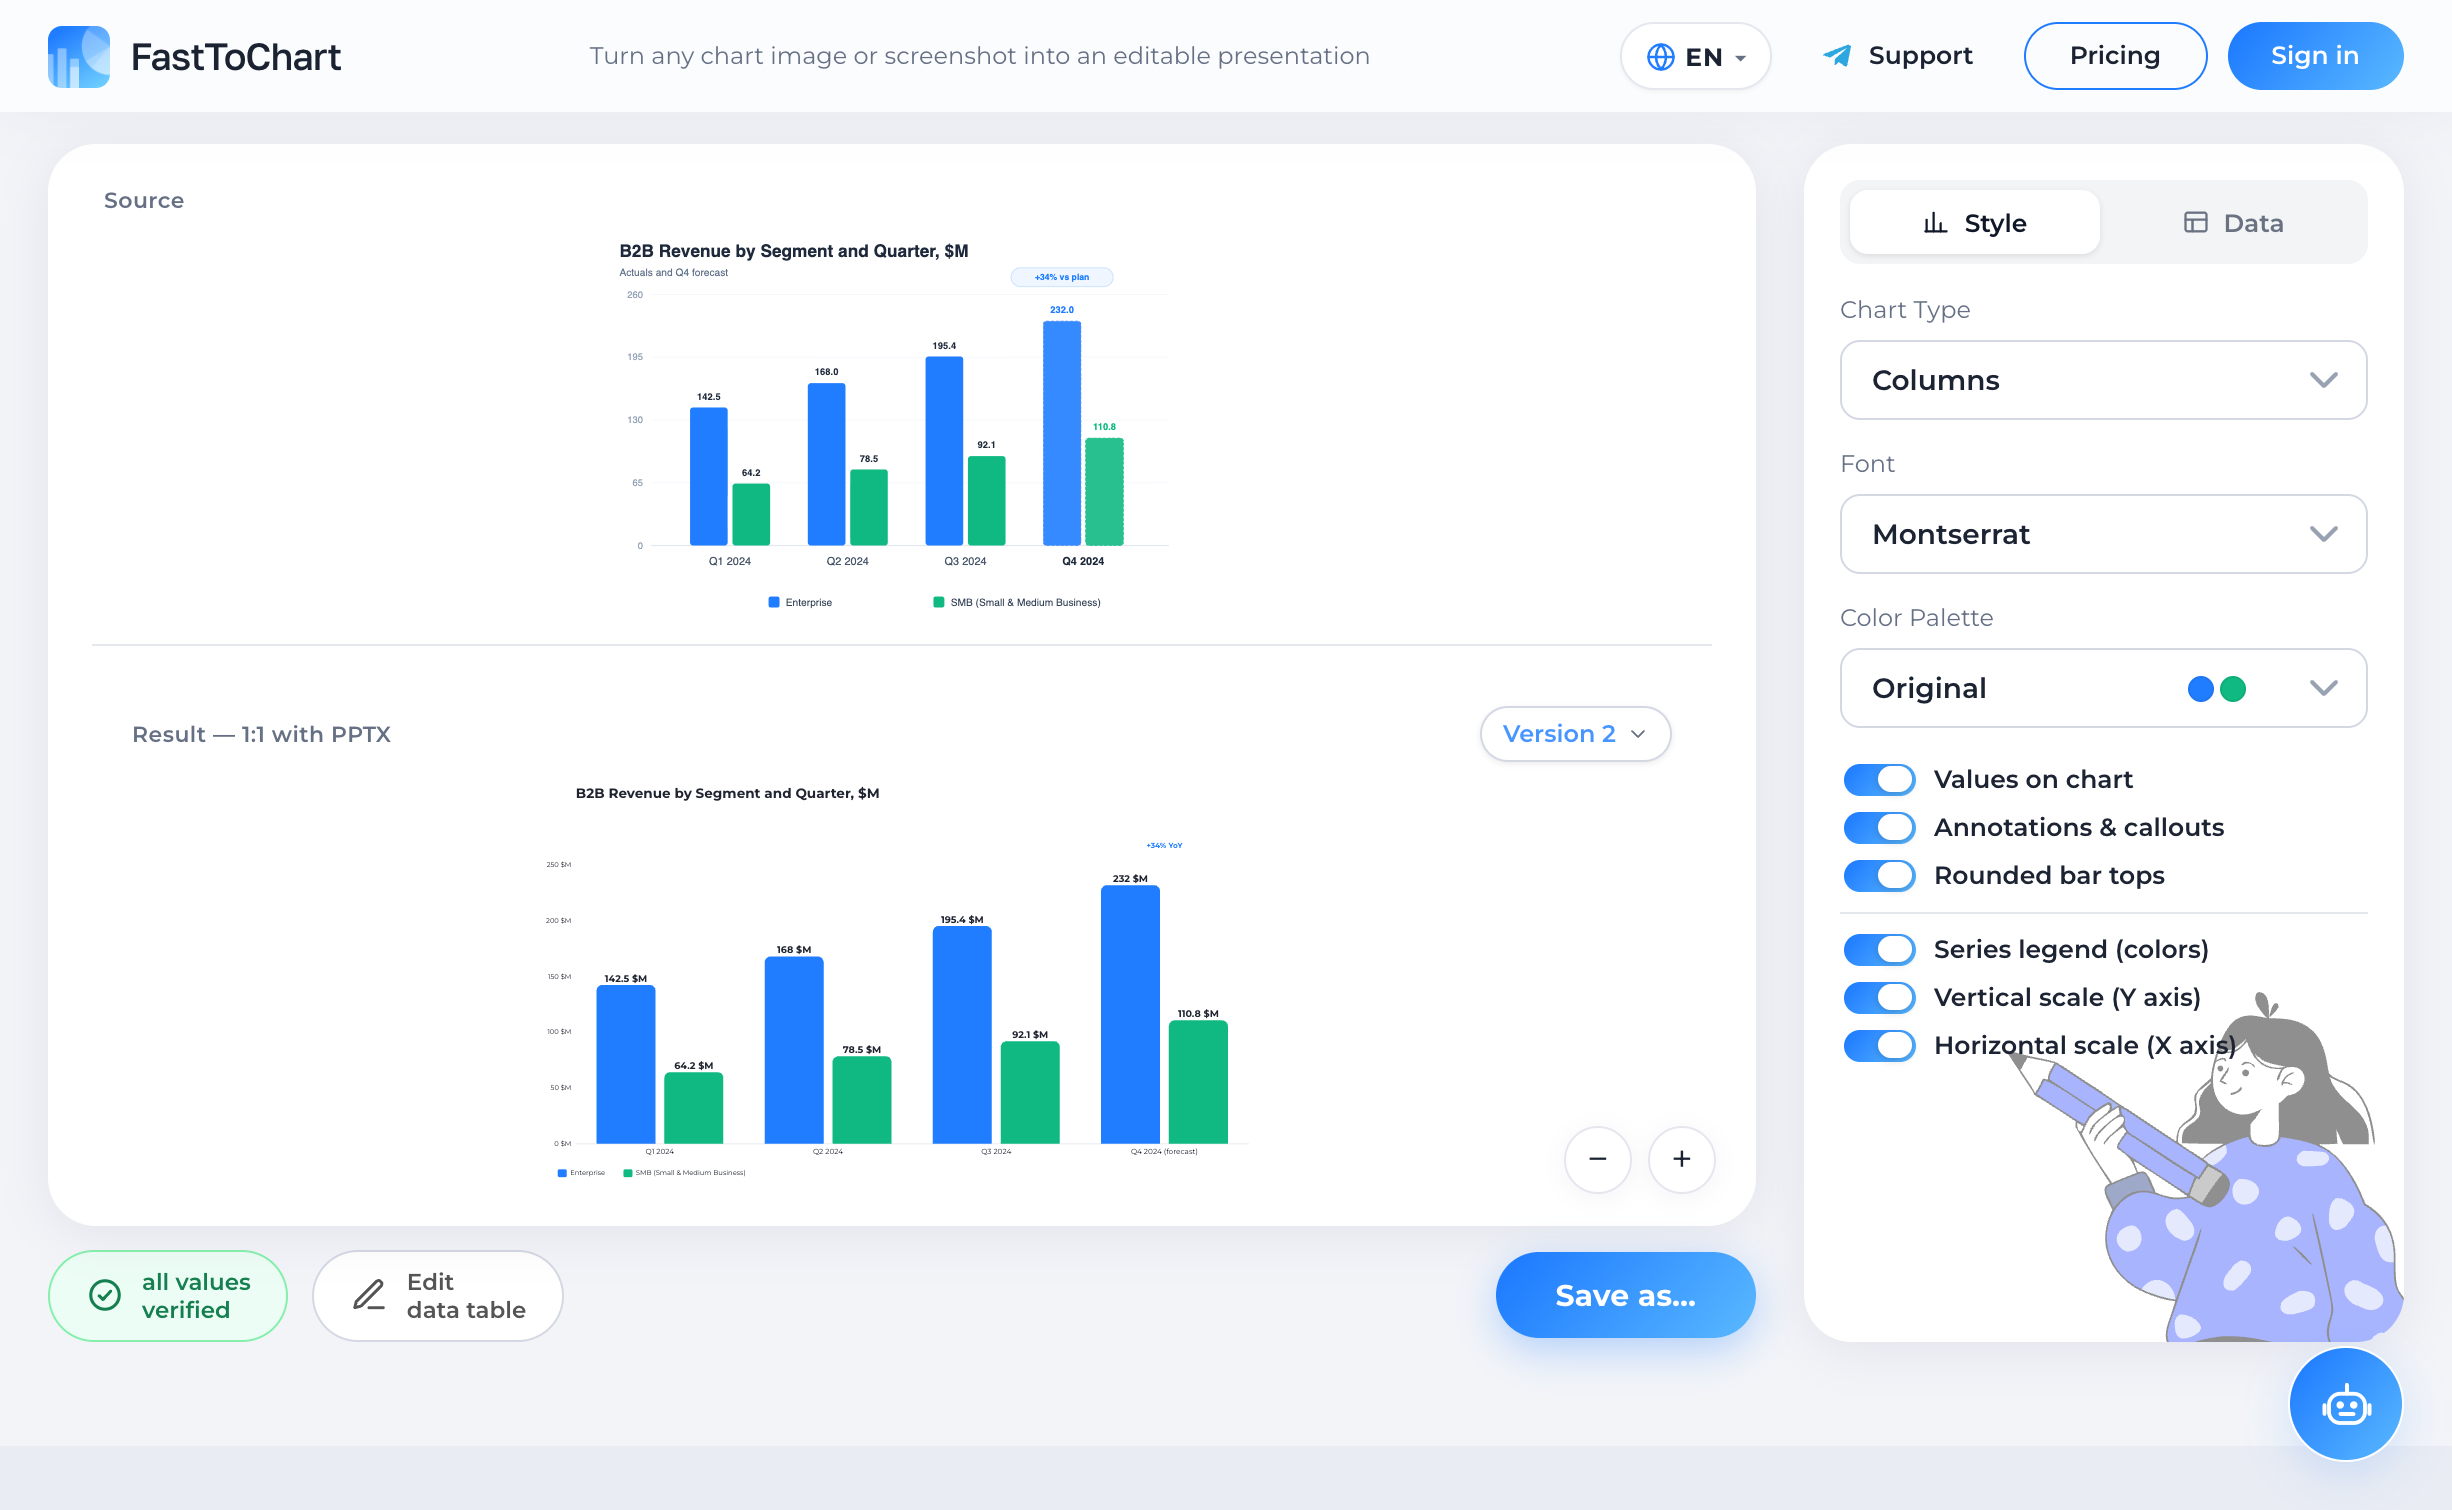
Verify extracted values, update numbers, and customize styling in a unified editor.
- Data table alongside your chart
- Colors and labels under your control
- Editable presentation-ready files
Structured Numerical Data Ready for Formulas
The exported spreadsheet is organized logically: category labels in column A, followed by one column for each series. Values are saved as pure unformatted numbers, allowing immediate summation, VLOOKUP, and pivot table modeling.
Original formatting indicators—such as percentages, currency symbols ($/€/£), and magnitude multipliers (K/M/B)—are preserved in column metadata and number formats.
Dedicated Data Confidence Sheet
In high-stakes financial and research modeling, knowing data pedigree is critical. FastToChart includes a secondary 'Confidence' worksheet inside the .xlsx file that documents the extraction certainty percentage for every single cell.
Export to CSV and TSV
Frequently Asked Questions
FastToChart automatically detects whether the source chart uses commas (e.g. 14,5%) or points (14.5%) and normalizes numbers cleanly into standard Excel numeric format.
Try it on your chart
Upload an image, presentation, or PDF — the first three recognitions are free, and editing data or exporting files is never metered.
Open tool